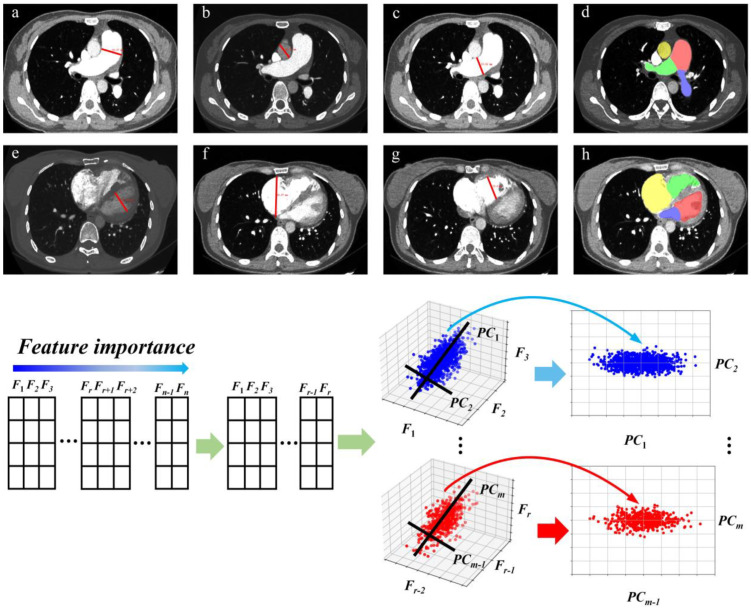
Figure 3.
Some of the morphological features on CTPA are shown above. (a) Diameter of main pulmonary artery (MPAd), (b) diameter of ascending aorta (AAd), (c) diameter of right pulmonary artery (RPAd), (d) area of LPA (blue), RPA (green), MPA (red), and AA (yellow), (e) diameter of left ventricle, (f) diameter of right atrium, (g) diameter of right ventricle, (h) area of LV (red), RV (green), LA (blue), and RA (yellow). They were all assessed on transversal images in the diastole. The features extracted from the original CTPA images were first organized in a table, sorted by the Spearman’s rank correlation coefficient between one feature and mean pulmonary artery pressure. Since any two features we selected may contain a strong correlation, we removed redundant features by calculating the Pearson coefficient of all features with each other. Then we selected r features from all features we obtained. The considerately selected features were then normalized and feature dimension reduction was performed by principal component analysis. Finally, we chose m features for the regression and classification model.

