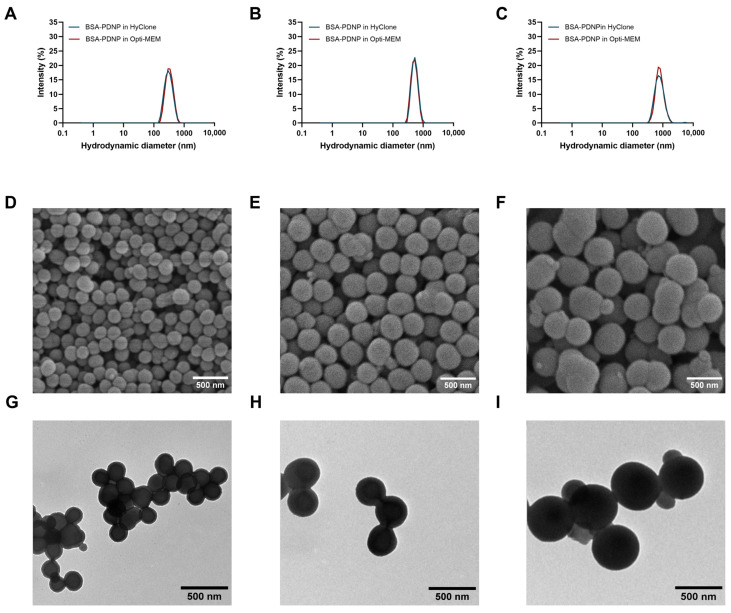
Figure 2.
Size and morphology characterization of BSA-coated polydopamine nanoparticles (PDNPs) of various sizes. (A–C) Representative intensity size distributions as measured by DLS of BSA-coated PDNPs of 300 nm (A), 500 nm (B) and 700 nm (C) in water (blue) and 15 min incubated in Opti-MEM (red). (D–F) Representative SEM images of BSA-coated PDNPs of 300 nm (D), 500 nm (E) and 700 nm (F). Scale bar = 500 nm. (G–I) Representative TEM images of BSA-coated PDNPs of 300 nm (G), 500 nm (H) and 700 nm (I). Scale bar = 500 nm.

