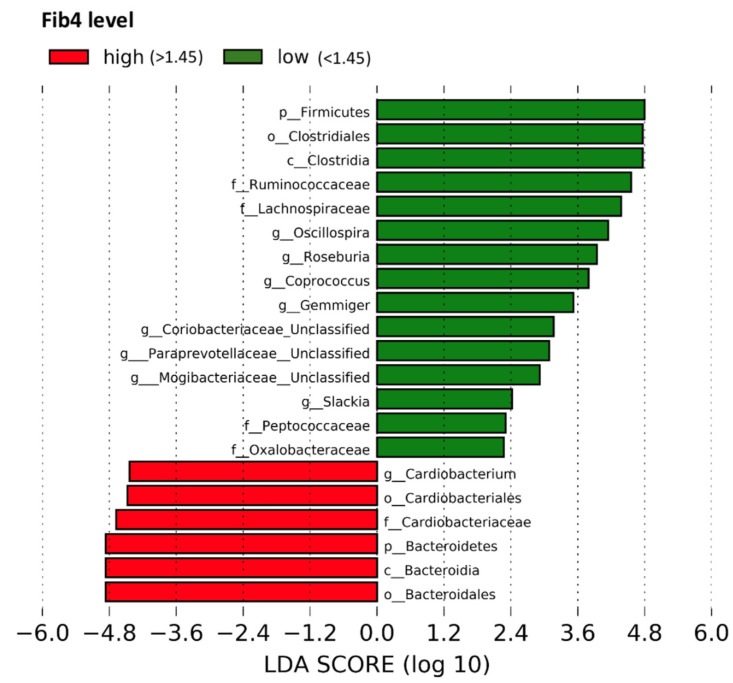
Figure 1.
Differential relative abundance of participants with and without FIB-4 ≥ 1.45. Figure 1 displays the results of the LEfSe analysis, which identifies the most differentially abundant taxa between participants with and without FIB-4 ≥ 1.45. FIB-4 score ≥ 1.45 was defined as “unable to exclude advanced liver fibrosis/cirrhosis”. Taxa enriched in participants with FIB-4 < 1.45 are indicated with a positive LDA score in green, and taxa enriched participants with FIB-4 ≥ 1.45 are indicated with a negative score in red. Abbreviations: FIB-4, Fibrosis-4 Index; LDA, linear discriminant analysis; LEfSe, linear discriminant analysis effect size.

