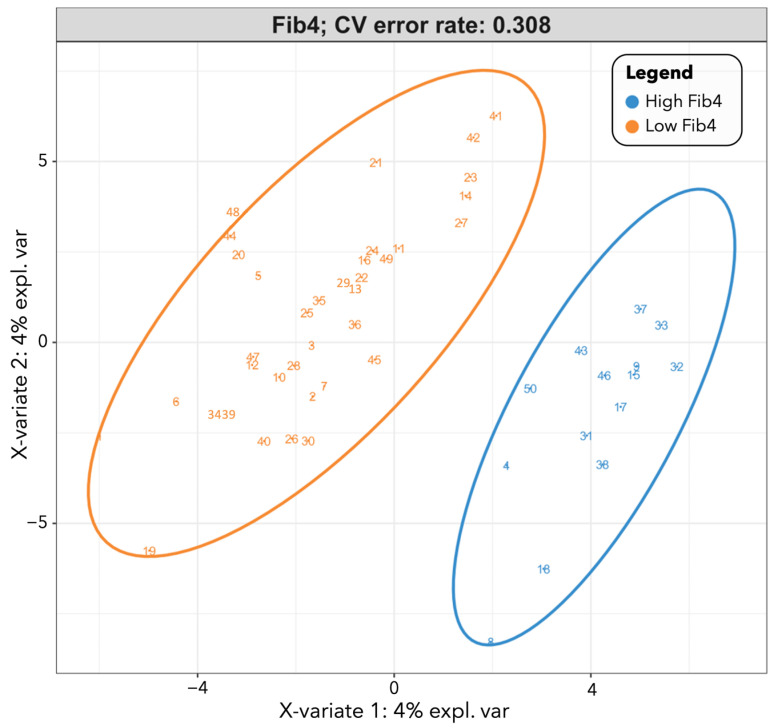
Figure 3.
PLS-DA score plot for participants with and without FIB-4 ≥ 1.45. Figure 3 displays the class prediction plot representing bacterial metabolites separating participants with and without FIB-4 ≥ 1.45 the most based on the first two principal components of the PLS-DA model. FIB-4 score ≥ 1.45 (“high FIB-4” label) was defined as “unable to exclude advanced liver fibrosis/cirrhosis”. Each point on the graph represents a participant, with blue circles representing participants with FIB-4 ≥ 1.45 and orange triangles representing participants with FIB-4 < 1.45. Abbreviation: PLS-DA, partial least squares–discriminant analysis.

