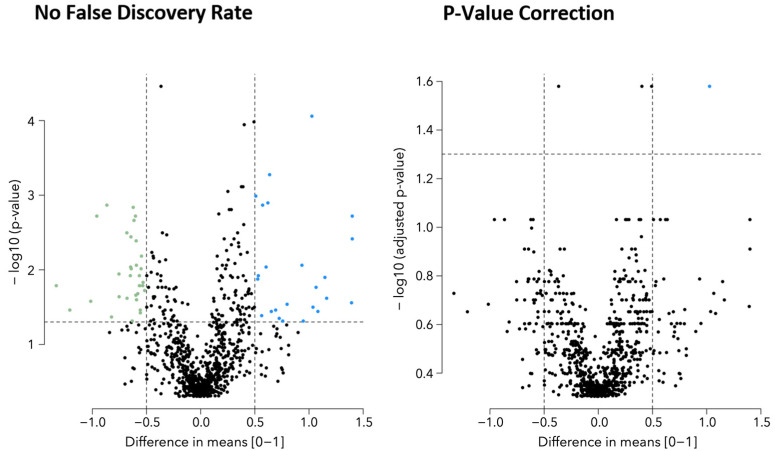
Figure A1.
Volcano plots to identify microbial metabolites that significantly differed between participants with and without FIB-4 ≥ 1.45. Figure A1 displays the volcano plots that were used to determine statistically significant metabolites that had an absolute difference in means (dm) >0.5 between those with and without FIB-4 ≥ 1.45. The X-axis shows the difference in means of the concentrations of the metabolites after the variance-stabilizing normalization, while the Y-axis shows a negative log of p-value determined by Wilcoxon rank-sum tests without false discovery rate (left plot) and with Benjamini–Hochberg p-value correction (right plot). Blue points (upper right) show metabolites that have significantly higher concentrations in the cohort with FIB-4 ≥ 1.45 (dm > 0.5, p-value < 0.05), while green points (upper left) show metabolites that have significantly higher concentrations in the group with FIB-4 < 1.45 (dm < −0.05, p-value < 0.05). The two vertical dotted lines represent the two thresholds showing dm >0.5, while the dotted horizontal line represents a p-value threshold of 0.05 (i.e., negative log p-value of 1.3). FIB-4 score ≥ 1.45 was defined as “unable to exclude advanced liver fibrosis/cirrhosis”. Abbreviation: FIB-4, Fibrosis-4 Index.

