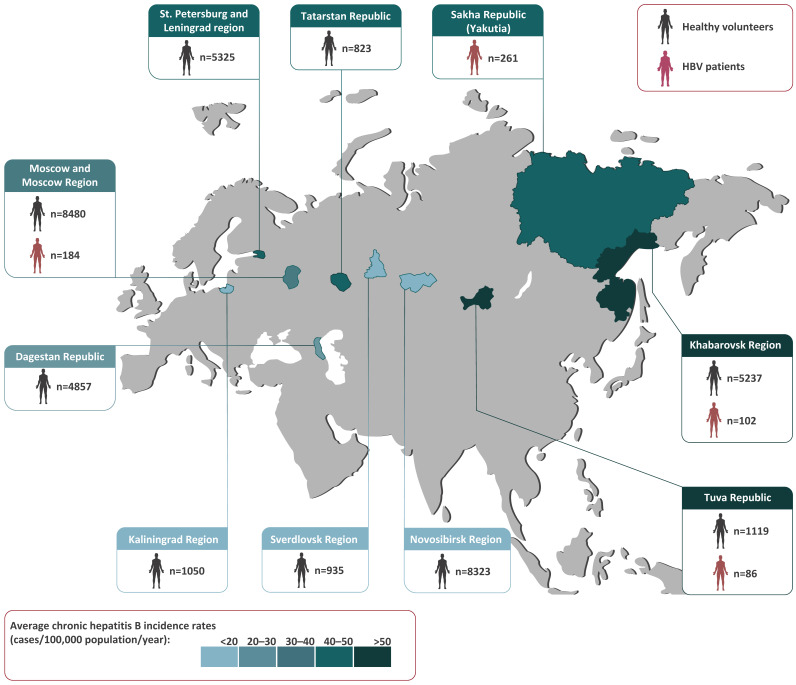
Figure 1.
The study regions (in color) shown on a map of Russia alongside the numbers and sources of the samples collected in each region. The colored bar represents the 11-year average chronic Hepatitis B incidence rates (cases per 100,000 population per year) from 2010–2021, based on a federal state surveillance report [4].

