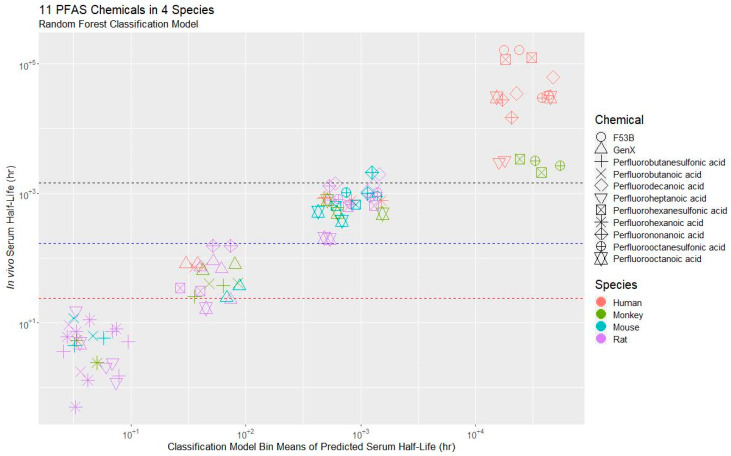
Figure 2.
Values of t½ of the training data (y-axis) vs. classification predictions by the RF Classification model using 15 predictors. Colors signify species, while shapes indicate different PFAS compounds. Bin margins (<12 h, 12 h−1 week, 1 week–2 months, >2 months) are indicated as dotted lines. Note that observations have been jittered (that is, a small amount of random variation has been added) along the x-axis to increase readability.

