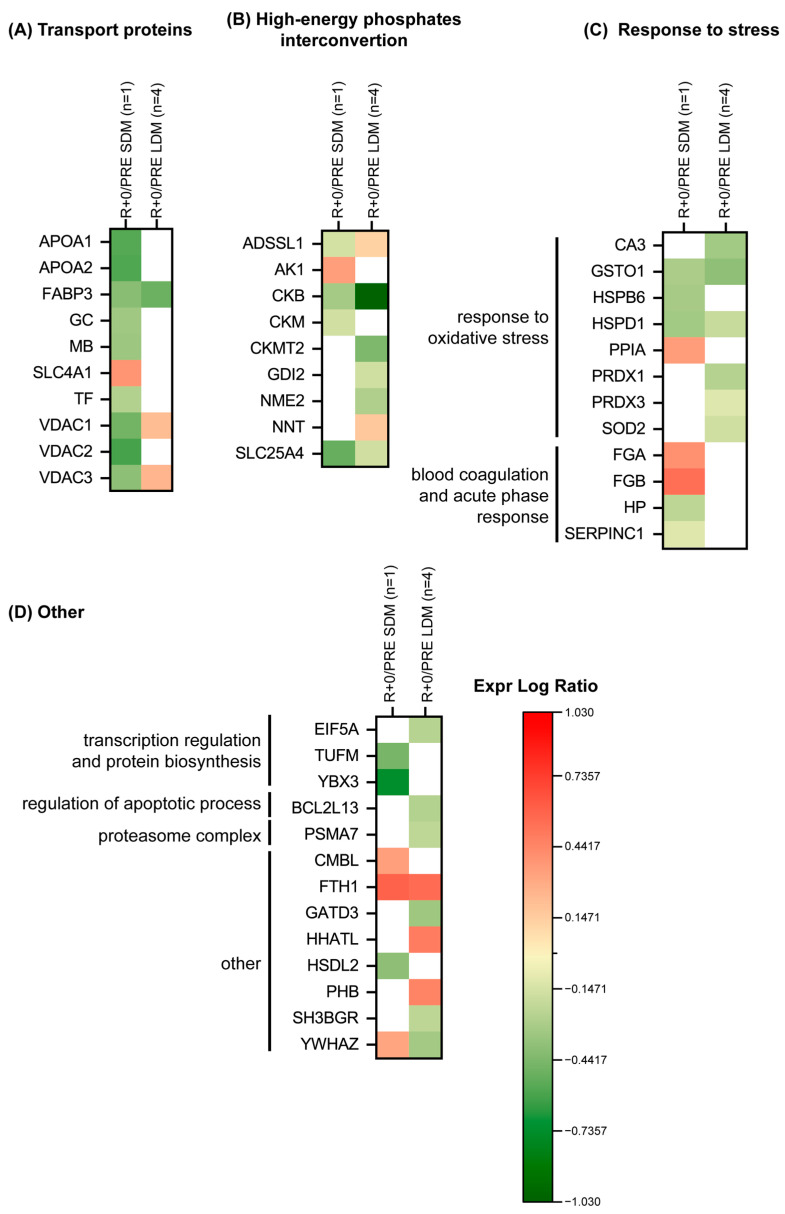
Figure 8.
Heatmap of protein levels classified according to a functional category, (A) transport proteins, (B) high-energy phosphates interconvertion, (C) response to stress, (D) other Green and red colors refer to statistically significant decrease or increase for each protein (R+0 vs. PRE SDM, paired Student’s t-test and FDR, n = 1, p < 0.05; R+0 vs. PRE LDM, paired Student’s t-test and FDR, n = 4, p < 0.05) in our proteomics datasets.

