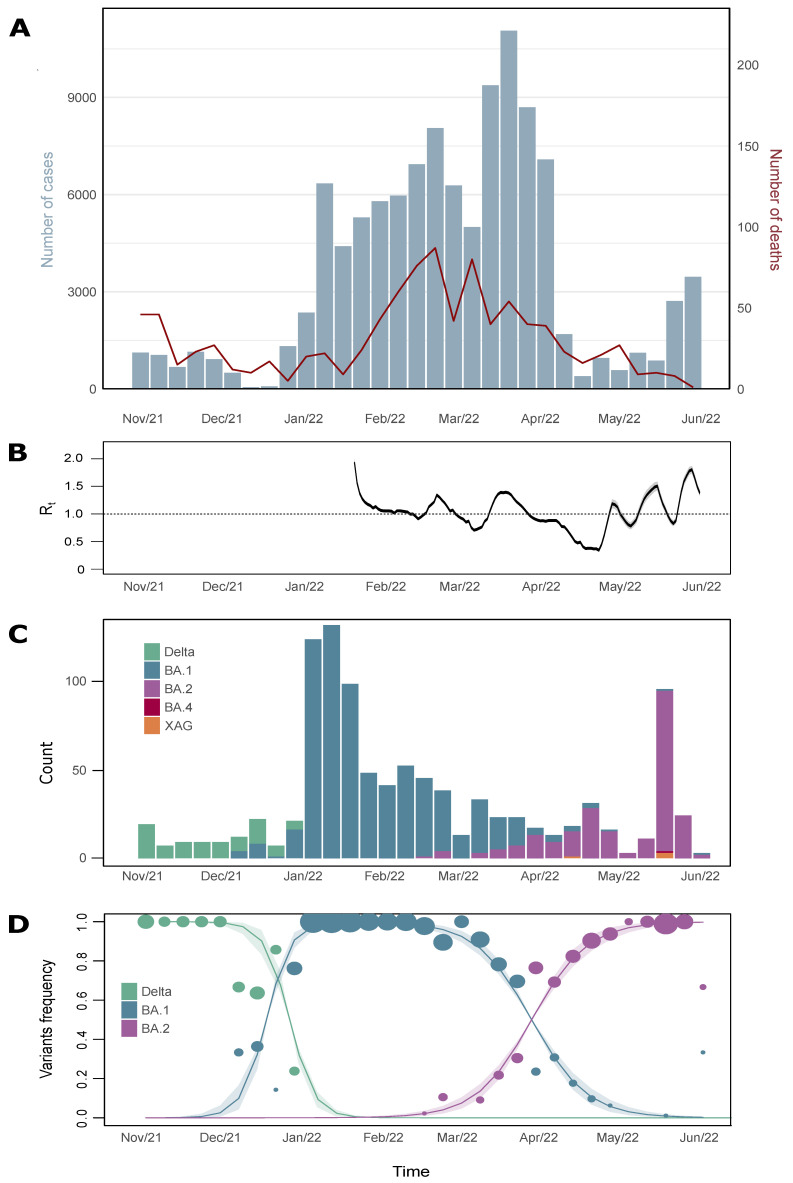
Figure 1.
SARS-CoV-2 epidemiological monitoring during November 2021 and June 2022 (EWs 44-2021 and 22-2022); (A) Number of positive cases (blue bars) and deaths (red line) by COVID-19 reported in Minas Gerais state; (B) Reproductive number of virus infection during the Omicron transmission period in MG; (C) VOC prevalence profile in MG, according to sequences released in GISAID database; (D) Multinominal model analysis with the genome-released data during the study period in the state. The circles are proportional to genome numbers obtained for each variant. Line shadows are representative for 95% HPD.

