Figure 2.
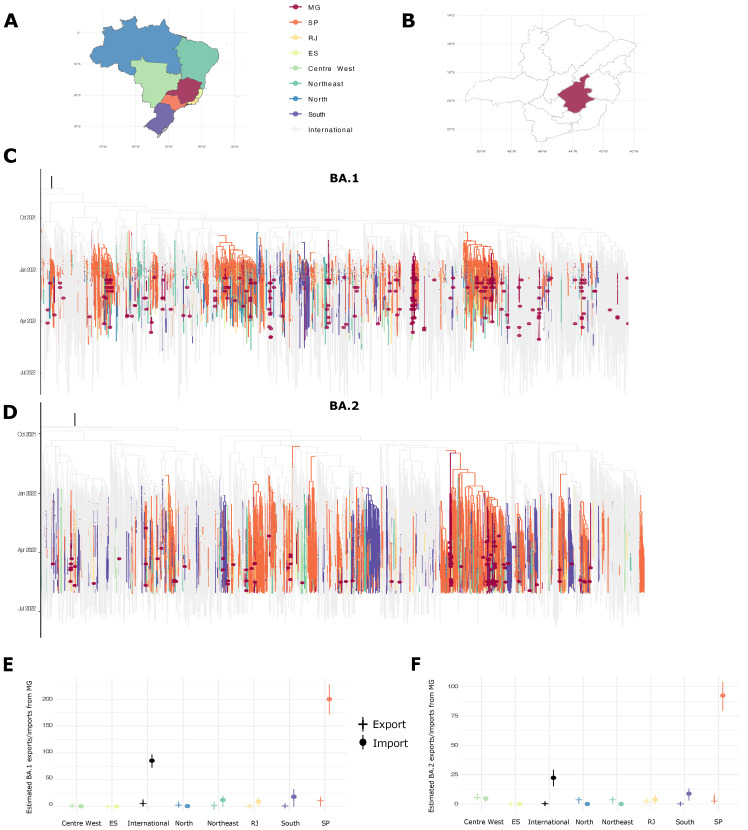
Omicron BA.1 and BA.2 phylogenetic reconstruction in Minas Gerais; (A) Map of Brazil colored by regions selected for phylogeography analysis: Minas Gerais state (MG), São Paulo state (SP), Rio de Janeiro state (RJ), Espírito Santo state (ES), and Centre-West, Northeast, North, and South Brazilian regions; (B) Map of MG state macro-regions, showing in dark red the metropolitan Belo Horizonte region; (C,D) Bayesian reconstruction demonstrates MG sequences distributed along the tree, suggesting different imports in the region for BA.1 and BA.2 lineages. Dark red circles represent sequences generated in this study. Tree branch colors are corresponding to geographical sequence locations as shown in the map; (E,F) Regional estimates of the imports and exports of the BA.1 and BA.2 viruses to/from MG, regionally colored as the map.

