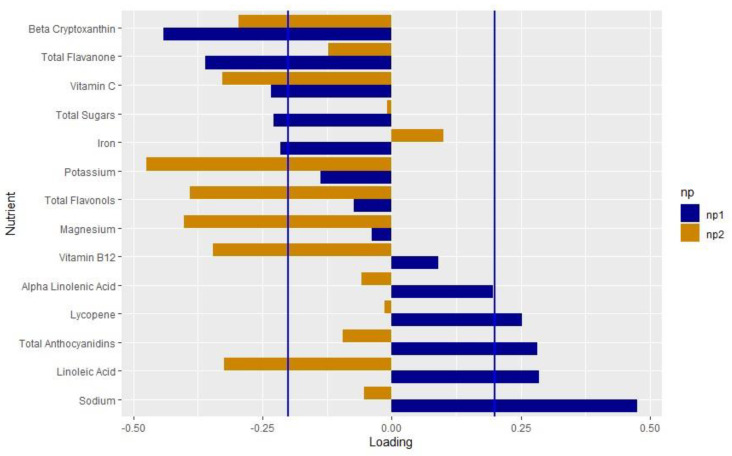
Figure 2.
Loadings of the nutrient pattern: Loading values from the nutrient patterns extracted using reduced rank regression with genetically adjusted oxylipin PC1 and PC2 as the response variables. The nutrients are listed on the y-axis and the loading value is indicated on the x-axis. Blue bars indicate the loading values for NP1; orange indicates values for NP2. Blue lines mark the cutoff of the nutrients that load importantly, >|0.2|.

