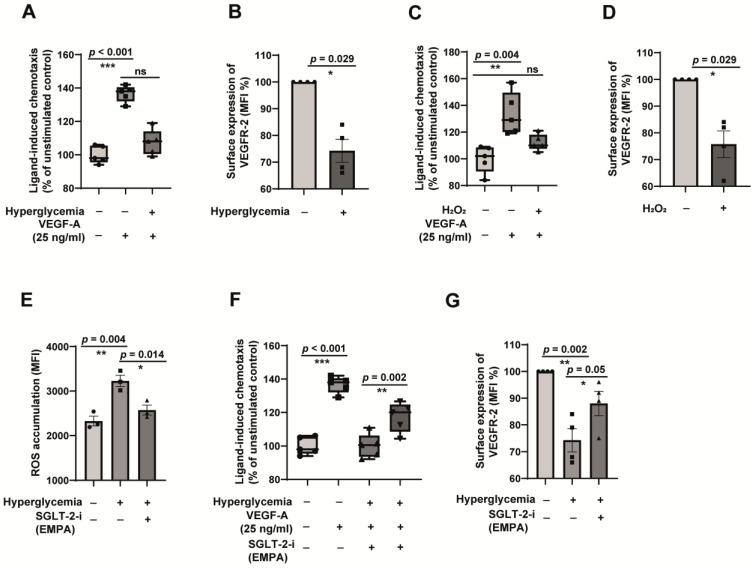
Figure 5.
Empagliflozin reverses hyperglycaemia-induced endothelial dysfunction by reducing oxidative stress. (A) HUVECs were exposed to in vitro normoglycemic conditions (5 mM glucose) or hyperglycaemic conditions mimicking a diabetic milieu (30 mM glucose + 100 µM methylglyoxal) for 24 h. The cells were then analysed for their ability to undergo chemotaxis (directional migration) towards angiogenic stimuli VEGF-A. Boyden chamber assays were performed. n = 5. (B) HUVECs were exposed to in vitro normoglycemic conditions (5 mM glucose) or hyperglycaemic conditions mimicking a diabetic milieu (30 mM Glucose + 100 µM methylglyoxal) for 24 h. Thereafter, FACS analysis of the surface expression of VEGFR-2 on hyperglycaemic HUVECs was done. (n = 5). All data are means ± SEM. (C) HUVECs were exposed to in vitro normoglycemic conditions (5 mM glucose) in the presence of 200 µM H2O2 for 24 h. After that, the cells were analysed for their ability to undergo chemotaxis towards VEGF-A using Boyden chamber assays. n = 5. (D) HUVECs were exposed to in vitro normoglycemic conditions (5 mM glucose) in the presence of 200 µM H2O2 for 24 h. After that, the cells were analysed for the surface expression of VEGFR-2 using FACS. n = 4. Data are means ± SEM. (E) HUVECs were exposed to in vitro normoglycemic conditions (5 mM glucose) or hyperglycaemic conditions mimicking a diabetic milieu (30 mM Glucose + 100 µM methylglyoxal for 24 h. The reactive oxygen species (ROS) accumulated was detected by fluorescence spectroscopy using 5-(and-6)-carboxy-2′,7′-difluorodihydrofluorescein diacetate (H2-DFFDA) reagent. n = 3. All data are means ± SEM. (F) HUVECs were exposed to in vitro normoglycemic conditions (5 mM glucose) or hyperglycaemic conditions mimicking a diabetic milieu (30 mM Glucose + 100 µM methylglyoxal) for 24 h in the presence or absence of 100 ng/mL SGLT-2 inhibitor empagliflozin. After that, the cells were analysed for their ability to undergo chemotaxis towards VEGF-A using Boyden chamber assays. n = 5 (G) FACS analysis of the surface expression of VEGFR-2 of the cells grown under conditions as described for F. n = 4. All data are means ± SEM. ns = non-significant. * p < 0.05, ** p < 0.01 and *** p < 0.001.

