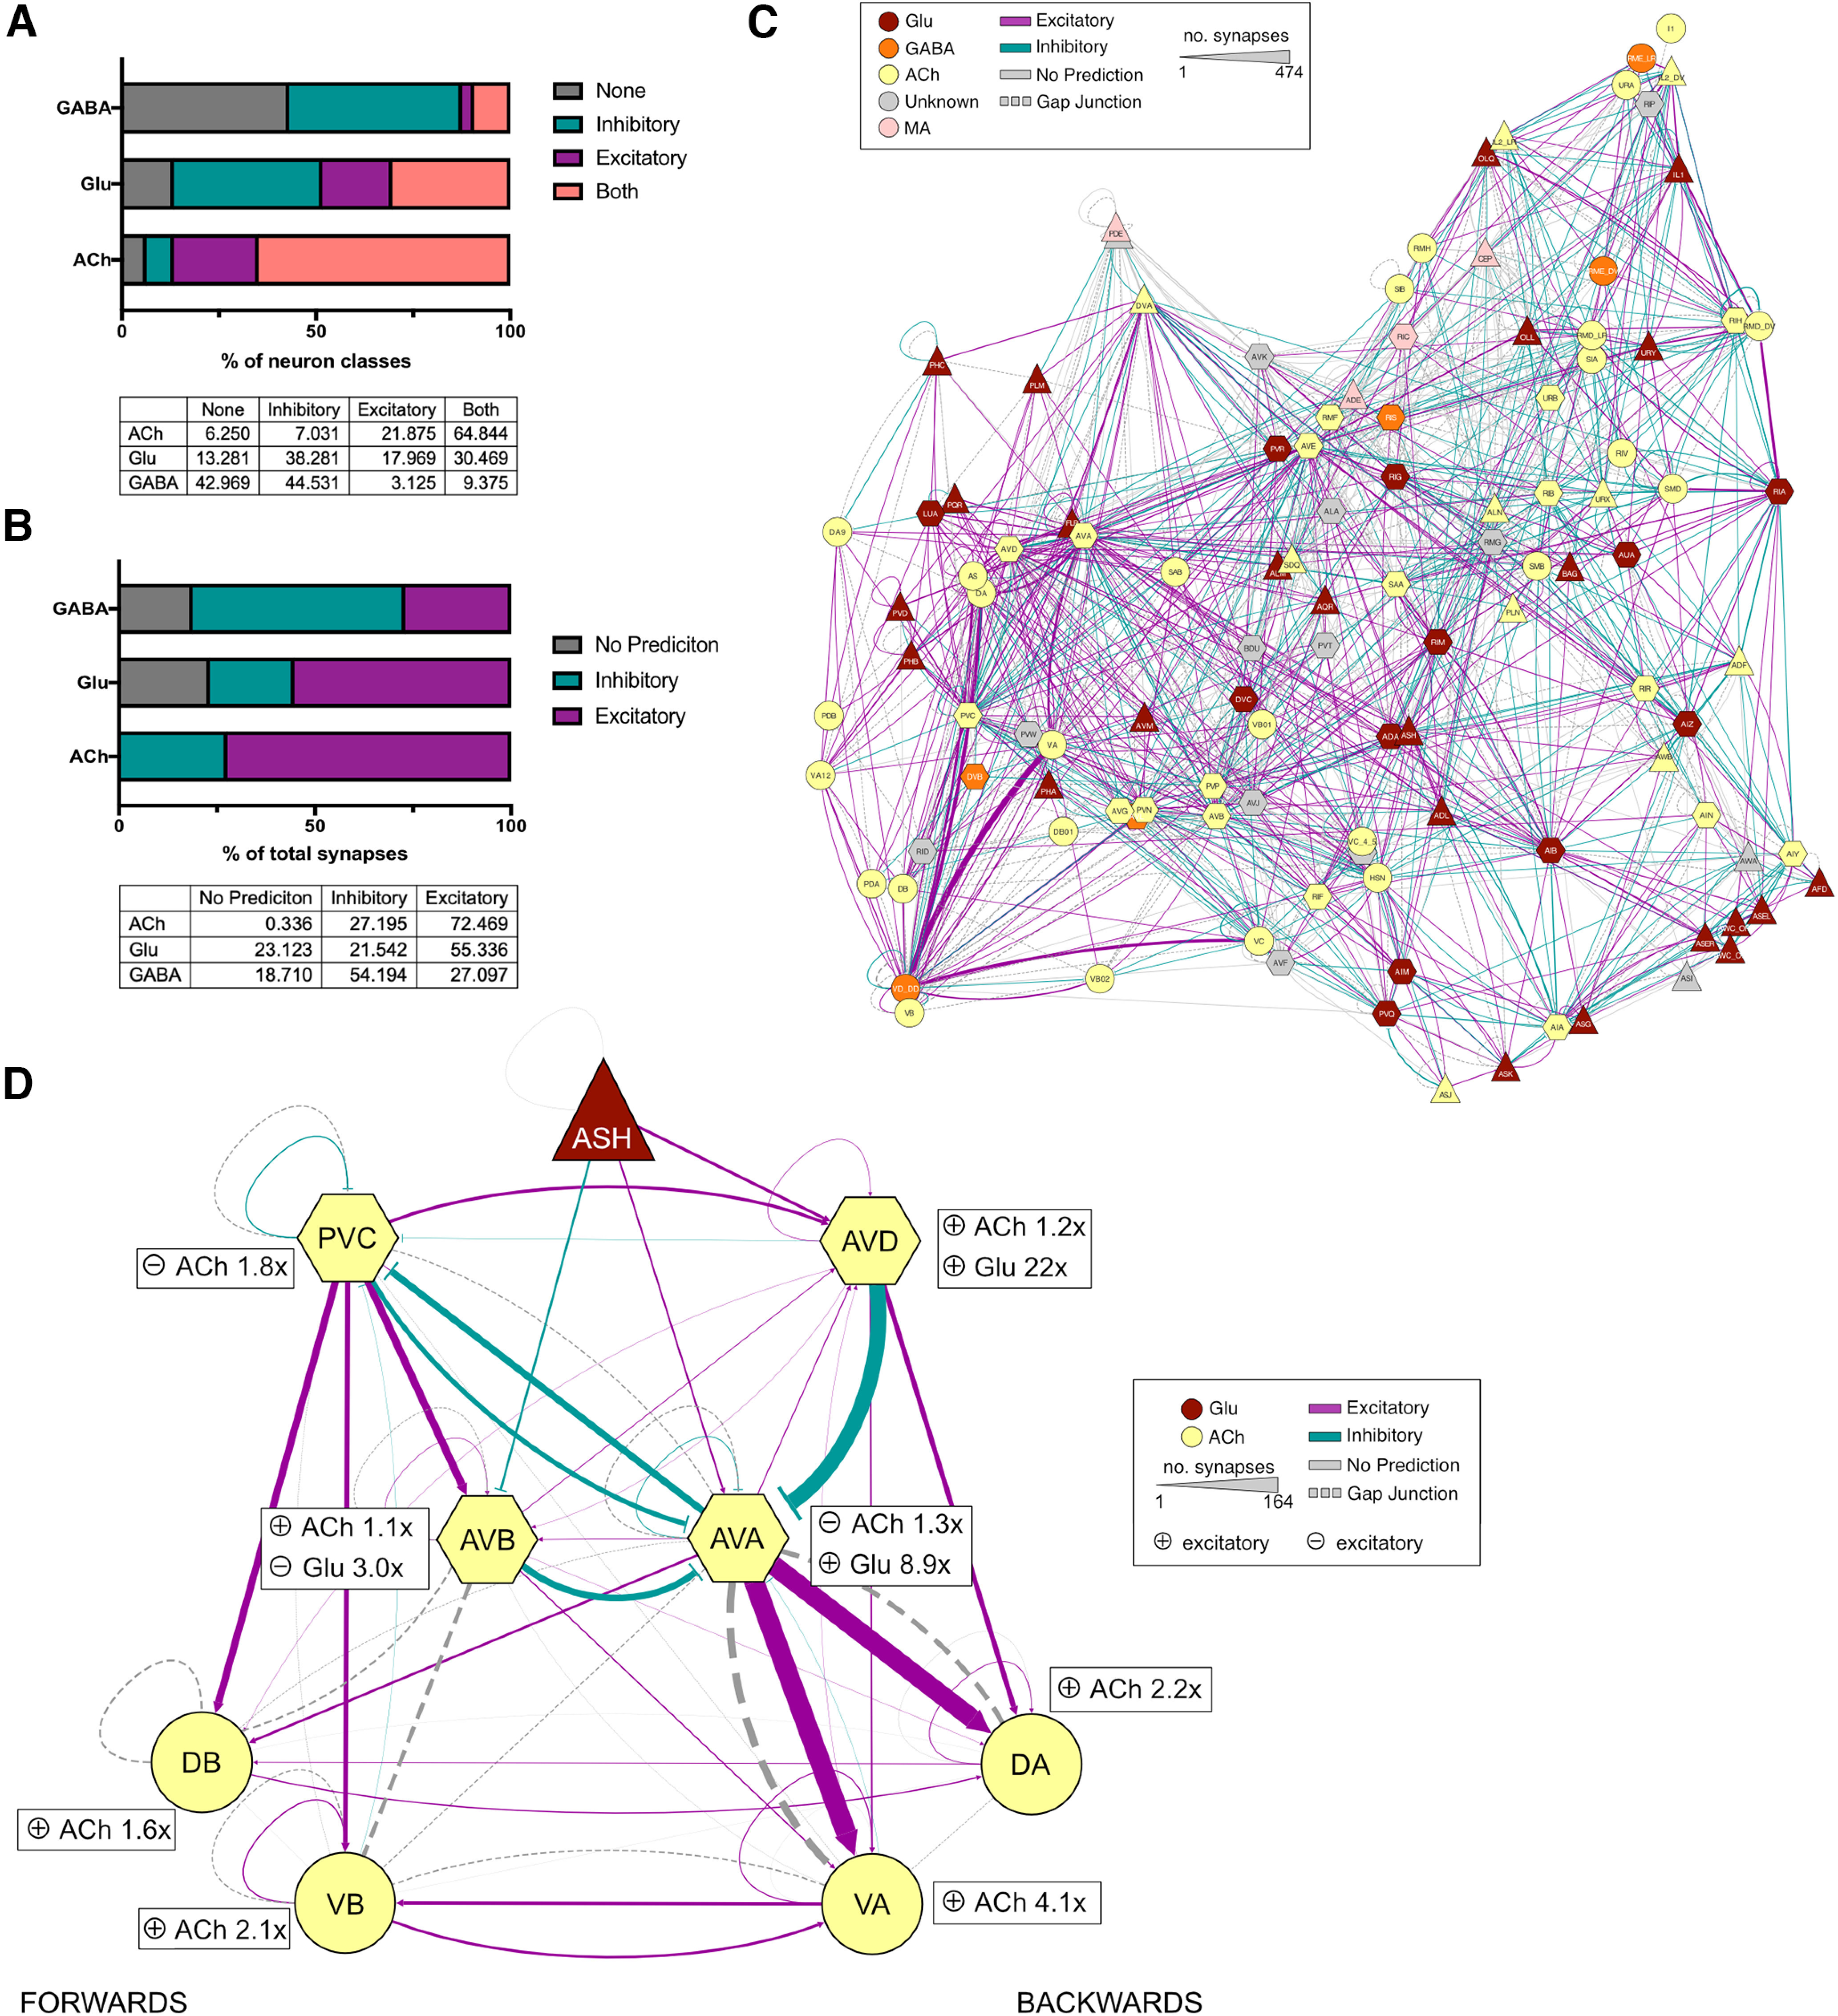
Figure 5.

Predicting synapse polarity based on LGIC expression. A, Bar chart and table depicting the percentage of total neuron classes expression inhibitory, excitatory, both or no ionotropic receptors for GABA, Glu, and ACh. B, Bar chart and table depicting the percentage of total synapses for a given neurotransmitter that are predicted to be inhibitory, excitatory, or have no prediction. C, Network diagram depicting the polarity of synaptic connections between neural classes. The connection color shows polarity: teal, inhibitory; pink, excitatory; gray, no prediction. Gap junctions are represented in dashed lines. Line weight represents the number of synapses, and nodes are colored by the major neurotransmitter released by that class. Diagram made with cytoscape using the EntOpt clustering package. D, Network diagram depicting the predicted polarity of the locomotion circuit. The connection color shows polarity: teal, inhibitory; pink, excitatory; gray, no prediction. Inserts next to each neuron node show the fold magnitude of expression of the major receptor type for each neurotransmitter in each neural class (e.g., AVA neurons express 1.3× as many inhibitory ACh receptors than excitatory and 8.9× as many excitatory glutamate receptors than inhibitory). Gap junctions are represented by dashed lines. Line weight represents the number of synapses, and nodes are colored by the major neurotransmitter released by that class. Diagram made with cytoscape (Extended Data Figs. 5-1, binary polarity predictions for each neuronal class, 5-2, expression heatmap of the 3 major neurotransmitters; Extended Data Table 5-1, list of LGC ligands).
