Fig. 2.
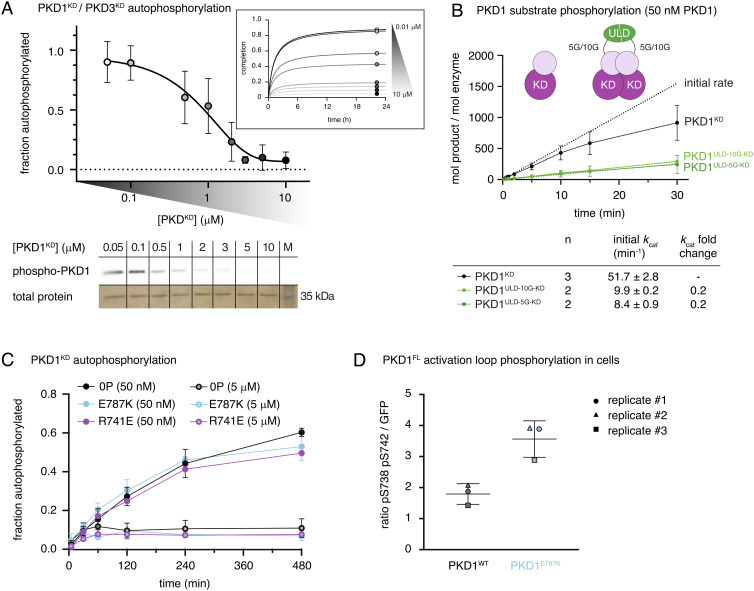
Dimerization of the kinase domain is autoinhibitory. (A) Radiometric autophosphorylation assay of PKD1KD and PKD3KD. Error bars are the SD of two to four biologically independent experiments. Inset: Data points represent a reaction plateau at corresponding PKDKD concentrations. Bottom: Representative autoradiograph of PKD1KD samples compared to that of loading control (silver stain). (B) Substrate phosphorylation kinetics of PKD1KD compared to those of ULD-mediated PKD1KD dimers with either (Gly)5 or (Gly)10 linkers between the ULD and kinase domains. Assay performed at concentrations corresponding to monomeric PKD1KD. Error bars are the SD of n biologically independent experiments. Table indicates the number (n) of replicates and the values for kcat derived from a linear regression in the linear range. (C) Autophosphorylation kinetics of wild-type PKD1KD compared to those of monomeric PKD1KD E787K at low (50 nM) and high (5 μM) concentrations. Error bars are the SD of three biologically independent experiments. (D) PKD1 activation loop phosphorylation in HEK293T cells. Wild-type PKD1 (black) and PKD1 E787K (cyan).

