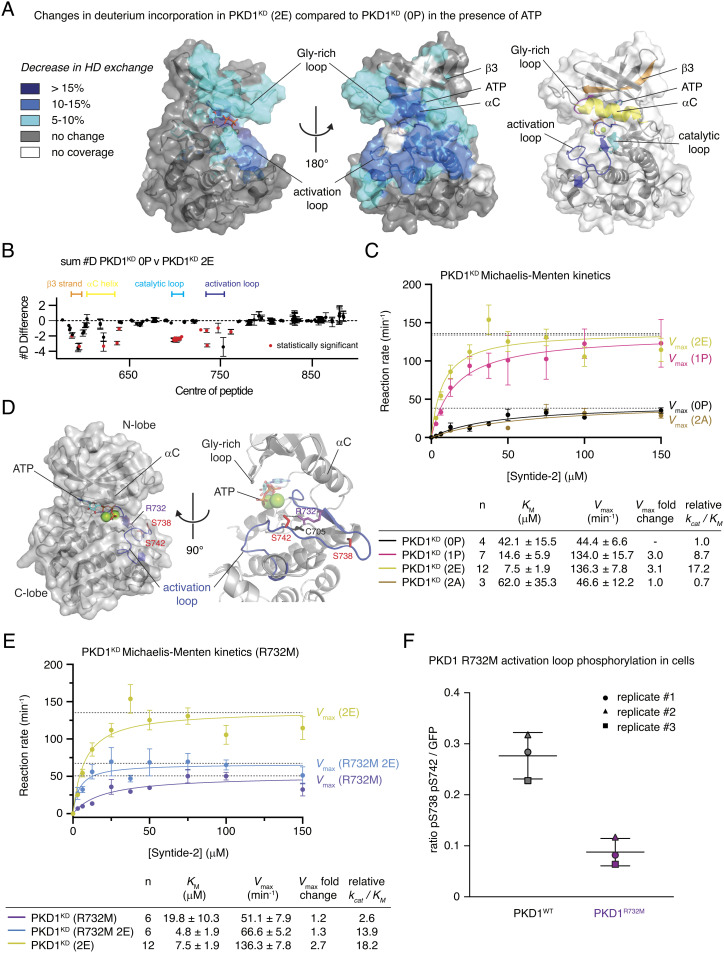
Fig. 4.
Activation loop autophosphorylation increases PKD1 catalytic activity. (A) Significant differences in deuterium incorporation in PKD1KD (2E) compared to those in unphosphorylated PKD1KD (0P) in the presence of ATP. Changes mapped onto the kinase domain of PKD1. Differences in exchange in a peptide were considered significant, if they met all three of the following criteria: ≥5% change in exchange and a ≥0.5-Da difference in exchange with a two-tailed t test value of less than 0.01 at any time point. Right: Color-coded cartoon of key structural elements that exhibit significant changes. Glycine-rich loop (magenta), strand β3 (orange), αC-helix (yellow), catalytic loop (cyan), and activation loop (blue). (B) The number of deuteron differences for all peptides analyzed over the entire deuterium exchange time course is shown, with each point representing an individual peptide (full exchange information for every peptide available in the source data). Statistically significant changes are indicated in red. (C) Michaelis–Menten kinetic analysis of PKD1KD substrate phosphorylation. Unphosphorylated PKD1KD (0P) (black), S742-phosphorylated PKD1KD (1P) (magenta), PKD1KD (2E) (yellow green), and PKD1KD (2A) (brown). Error bars are the SD of n biologically independent experiments. Table indicates the number (n) of independent biological replicates and the values for KM, Vmax, and catalytic efficiency (kcat/KM) derived from fitting the data with the Michaelis–Menten equation. (D) Rosetta homology model of the PKD1 kinase domain indicating the arrangement of side chains surrounding S742 in the activation loop. Activation loop (blue) and phosphoacceptor residues (red). (E) Michaelis–Menten enzyme kinetics of PKD1KD R732M (purple) compared to those of PKD1KD (2E) (yellow green) and PKD1KD R732M 2E (marine blue). Error bars are the SD of n biologically independent experiments. Table indicates the number (n) of independent biological replicates and the values for KM, Vmax, and catalytic efficiency (kcat/KM) derived from fitting the data with the Michaelis–Menten equation. (F) PKD1 activation loop phosphorylation in HEK293T cells. Wild-type PKD1 (black) and PKD1 R732M (purple).

