Fig. 1.
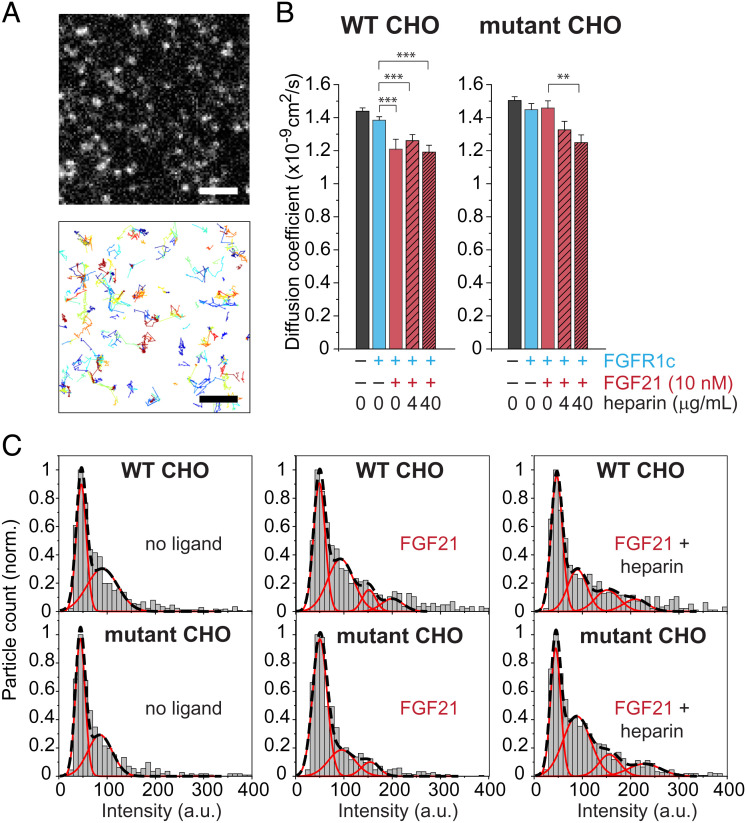
Single-molecule imaging of HaloTag-βKlotho. (A) Expanded view of HaloTag-βKlotho particles on the surface of a WT CHO cell imaged by TIRFM (Upper). The HaloTag on the extracellular portion of βKlotho was labeled with a cell-impermeant Alexa488 HaloTag ligand. A selected frame (100-ms exposure) from a 10-Hz recording is shown. (Scale bar, 2 μm.) Automated detection and tracking of moving HaloTag-βKlotho particles during a 10-s recording period (Lower). Single-particle tracking was performed as described in Materials and Methods. (B) Diffusion coefficient of HaloTag-βKlotho particles calculated from their MSD in WT and mutant (HSPG deficient) CHO cells under the following conditions: no ligands (40 cells each for WT and mutant cells); FGFR1c only (34 and 41 cells, respectively); FGFR1c and FGF21 (7 and 26 cells, respectively); FGFR1c, FGF21, and 4 μg/mL heparin (8 and 22 cells, respectively); and FGFR1c, FGF21, and 40 μg/mL heparin (7 and 23 cells, respectively). Error bars indicate mean ± SE, **P < 0.01 and ***P < 0.001 by Student’s t test. (C) Representative intensity distributions of HaloTag-βKlotho in cells under the indicated conditions of FGF21 (10 nM) and heparin (40 μg/mL). Intensities represent the volume under 2D Gaussian fits of the fluorescence of particles. Intensities were taken from the beginning (three frames) of each recording, and their distribution was fitted with a mixed Gaussian model. Black dashed lines, mixed fit. Red lines, individual components.

