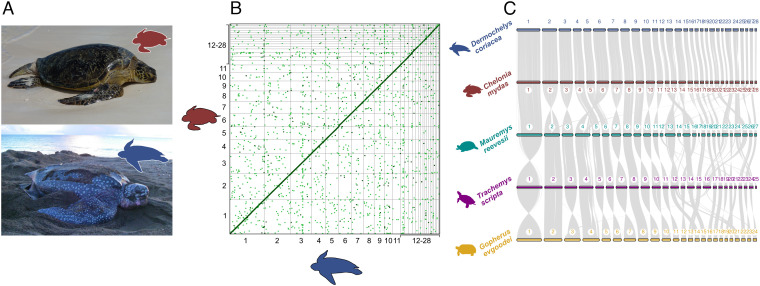
Fig. 1.
(A) Green turtle (C. mydas); photo credit: NOAA NMFS PIFSC under USFWS Permit #TE-72088A-3, and leatherback turtle (D. coriacea); photo credit: Ricardo Tapilatu. (B) Dot plot showing regions with an identity greater than 0.5 across the entire genomes of green (red) and leatherback (blue) turtles. (C) Gene synteny and collinearity among leatherback turtle (blue), green turtle (red), Chinese pond turtle (Mauremys reevesii; green), pond slider turtle (Trachemys scripta; purple) and Goode's thornscrub tortoise (Gopherus evgoodei; yellow). Each bar represents chromosomes with respective numbers, and gray lines represent homolog gene connections.

