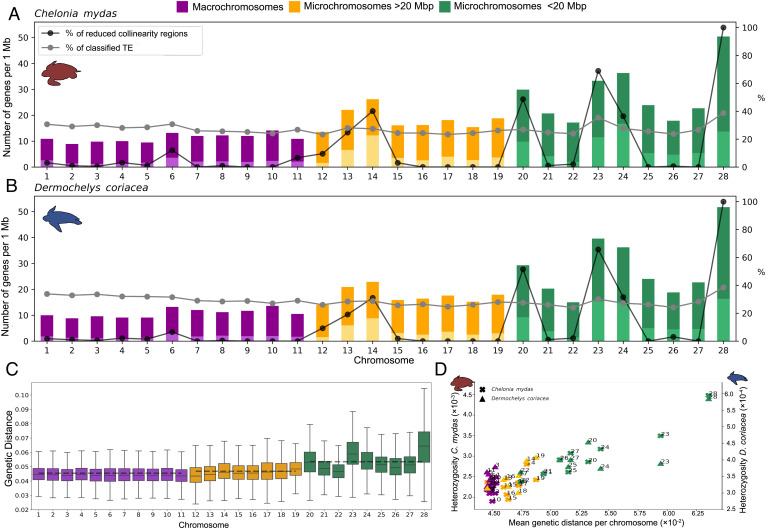
Fig. 3.
Number of genes, genetic distance between species, and heterozygosity within species in macrochromosomes, small (<20 Mb), and intermediate (>20 Mb) microchromosomes. (A) Relation between the number of genes, percentage of RRCs, and classified TE per chromosome for the green and (B) leatherback turtles. Dark colors indicate the total number of genes and light colors indicate the number of multicopy genes. (C) Average genetic distance between green and leatherback turtles per chromosome. (D) Relation between genetic distance and heterozygosity per chromosome for each species.

