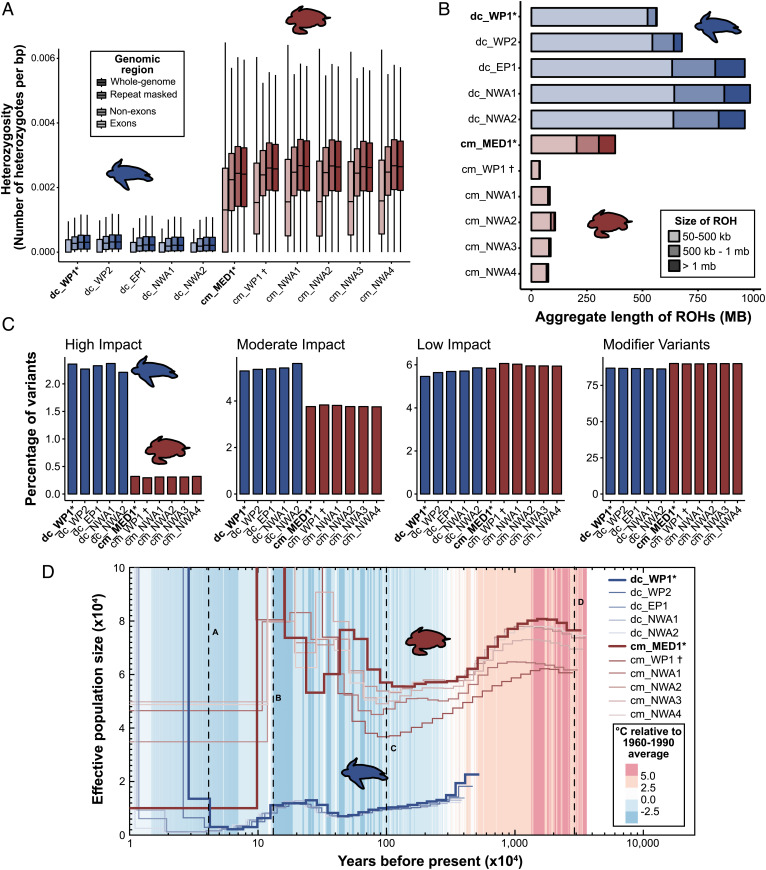
Fig. 4.
Data are presented for the leatherback (blue) and green (red) turtle genomes, including reference individuals for both species (*), and the individual used to generate the draft genome (†; Wang et al. 2013). (A) estimates of heterozygosity for the entire genome, repeat-masked genome, exon and nonexon regions, with outliers removed. (B) accumulated lengths of runs of homozygosity (ROH). (C) predicted impacts of variants from within coding regions. (D) Pairwise sequential Markovian coalescent plot (PSMC) of demographic history of both species overlayed with temperature. Letters indicating portions of the PSMC curves (A–D) are geological events referred to in the main text and SI Appendix, section I.

