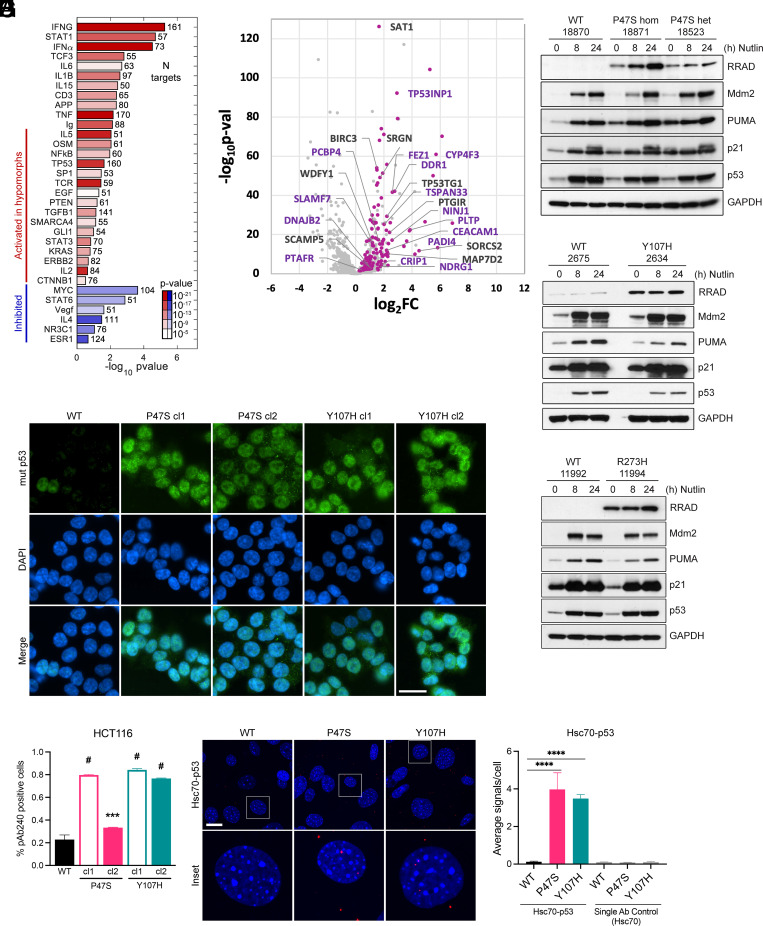
Fig. 1.
p53 hypomorphs adopt a mutant conformation and express high levels of RRAD. (A) IPA analysis showing significance and effect on regulators with their targets significantly enriched among the genes differentially expressed in p53 hypomorphs P47S and Y107H. The bars represent activation Z-score of the regulators predicted by IPA based on direction of target changes, color represents significance P value, and the number after the bar represents the number of targets affected. (B) Log2 fold change plotted against –Log10(P-value) for genes that respond to Nutlin-3a treatment after 24 h in WT. Highlighted pink are the genes that are activated to a greater extent in WT than in Y107H in response to treatment and labelled with names are the genes that behave similarly in P47S. The purple labels correspond to known p53 target genes. (C–E) LCL cell lines expressing hypomorphic p53 either (C) P47S—homozygous and heterozygous, (D) Y107H heterozygous, or (E) R273H heterozygous compared to regionally/family matched WT p53 LCL cell lines were treated with 10 μM Nutlin-3a for the indicated time points and harvested. Whole cell lysates were subjected to western blot analysis for the indicated antibodies. (F) WT, P47S, and Y107H HCT116 cells were analyzed for mutant p53 (pAb240) conformation by immunofluorescence analysis. (Scale bar, 25 μm.) (G) Quantification of the fraction of cells staining for mutant conformation (pAb240). Fractions indicated are such that 1.0 = 100%. Data are presented as mean ± SD. n = 25 random fields of view (>250 cells) from each of 2 independent experiments. ***P < 0.001; #P < 0.0001 by one-way ANOVA followed by Dunnett’s multiple comparisons test. (H) Primary MEFs generated from WT, P47S, and Y107H mice were used to assess mutant p53 conformation by p53-Hsc70 interaction using PLA. Representative images are shown for each condition (Scale bar, 20 μm.) White boxes denote the enlarged insets. (I) Quantification of the average number of PLA signals per cell. Values are expressed as mean ± SD. n = 6 random fields of view (>100 cells) from each of two independent experiments. ****P < 0.0001 by one-way ANOVA followed by Dunnett’s multiple comparisons test.

