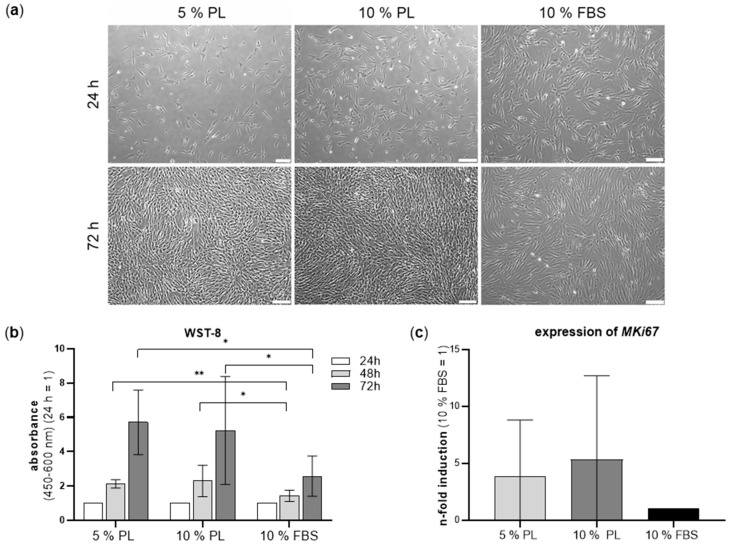
Figure 1.
Morphology, cell viability and proliferation marker of ADSC cultivated in 5% PL, 10% PL and 10% FBS. (a) Morphology of ADSC after 24 h and 72 h. Scale bar 200 µm. (b) Bar graphs show the relative cell viability of ADSC in different groups at 24–72 h. (c) Real-time PCR of MKI67 as proliferation marker represented as n-fold induction (10% FBS = 1). (n = 6, technical triplicates, * p ≤ 0.05, ** p ≤ 0.01).

