Figure 3.
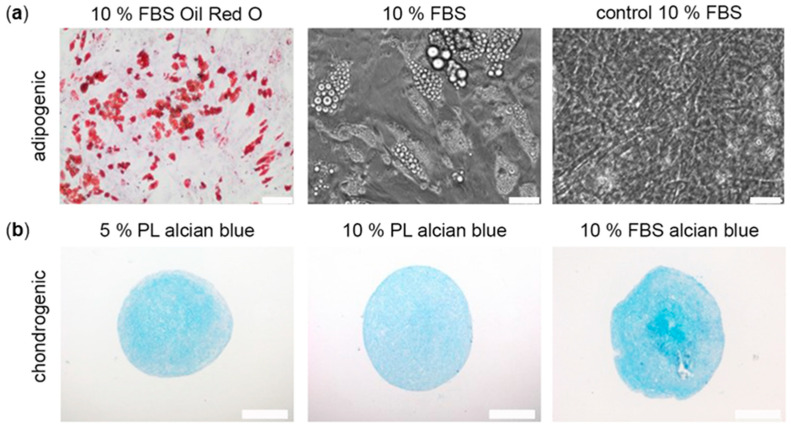
Effect of PL and FBS substitution on ADSC differentiation. (a) Representative images of FBS groups after adipogenic differentiation in Oil Red O staining and in phase contrast and of control groups in phase contrast. (b) Representative images of chondrogenic differentiated ADSC in alcian blue staining from day 28. Scale bar 200 µm.

