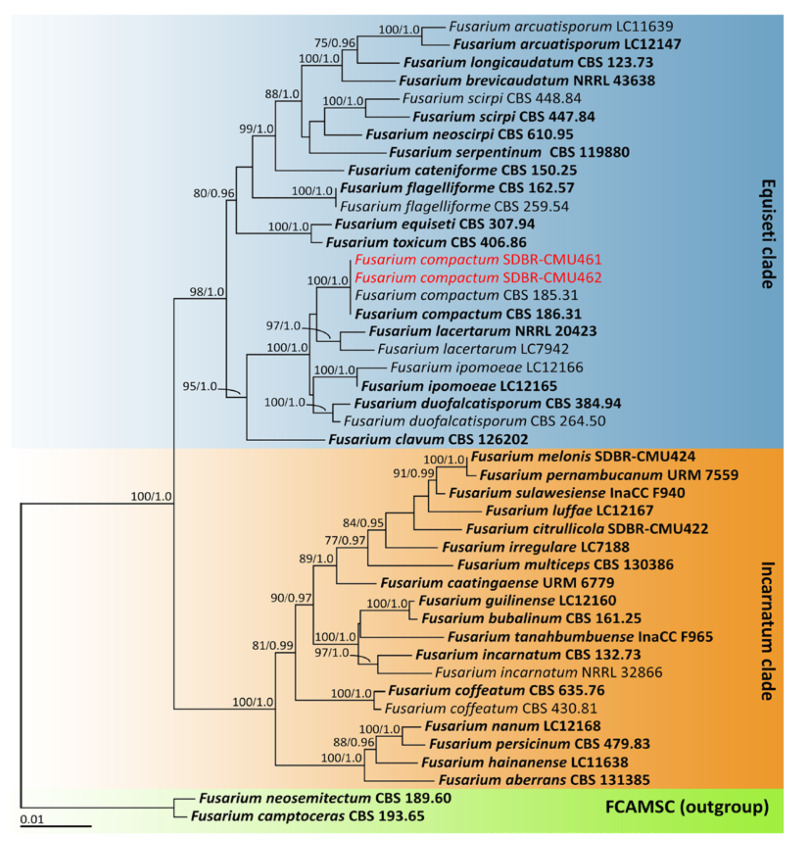
Figure 2.
Phylogenetic tree derived from maximum likelihood analysis of Fusarium incarnatum-equiseti species complex of the combined tef-1, cam and rpb2 sequences of 45 taxa. The outgroup included F. camptoceras CBS 193.65 and F. neosemitectum CBS 189.60. Numbers above branches are the bootstrap percentages (left) and Bayesian posterior probabilities (right). Branches with bootstrap and Bayesian posterior probabilities values greater than or equal to 75% and 0.95, respectively, are shown at each branch. The scale bar displays the expected number of nucleotide substitutions per site. The sequences of the fungal species derived in this study are shown in red. Type species are shown in bold.

