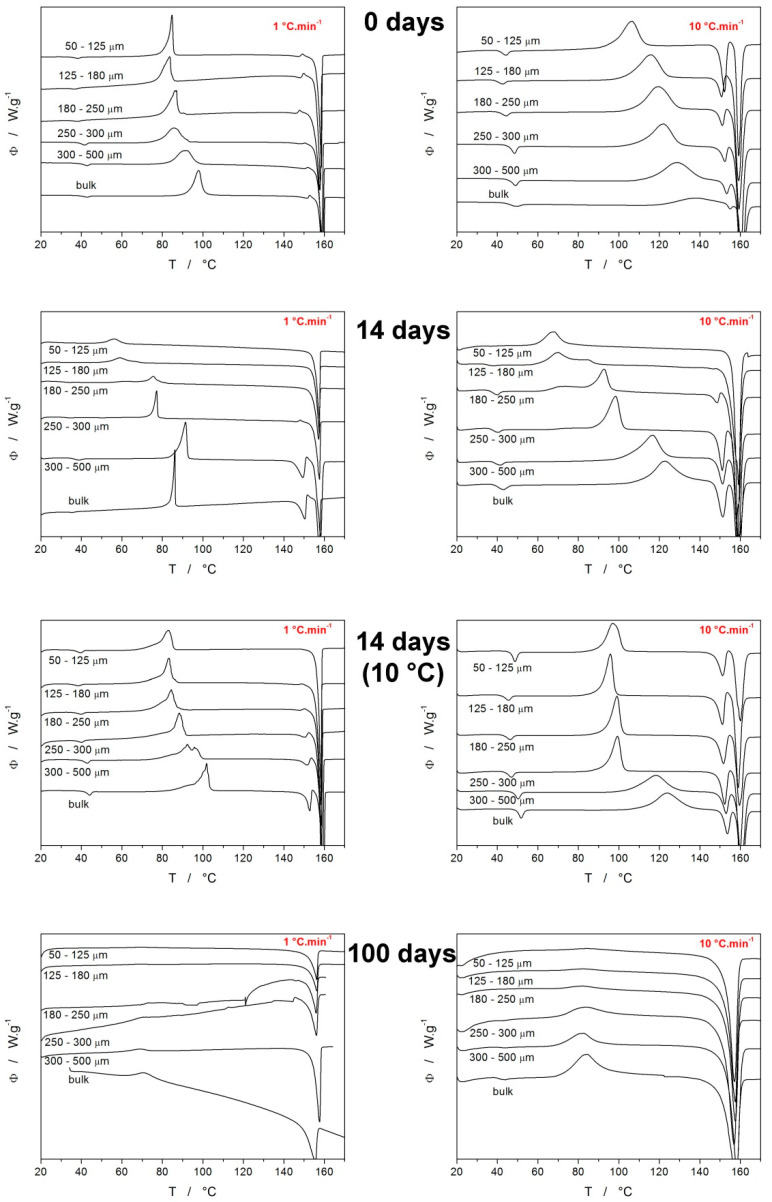
Figure 2.
Example DSC curves obtained at 1 and 10 °C·min−1 for various IMC powders with defined particle sizes. Each row of graphs corresponds to particular time and temperature storage conditions (powders were stored at laboratory temperature unless otherwise stated). Exothermic signals evolve in the upwards direction.

