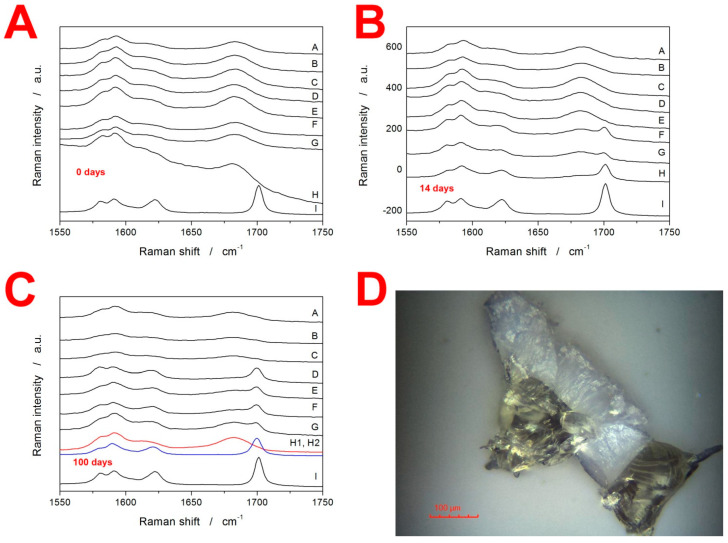
Figure 4.
(A–C) Raman spectra of IMC powders stored for 0, 14, and 100 days at laboratory temperature and humidity. The notation of the spectra is as follows: (A) 20–50 µm, (B) 50–125 µm, (C) 125–180 µm, (D) 180–250 µm, (E) 250–300 µm, (F) 300–500 µm, (G) bulk (~500–1000 µm), (H) true bulk IMC formed as a droplet of molten IMC being allowed to cool/freeze-in on a microscopy slide, and (I) initial as-purchased IMC powder used to prepare the amorphous IMC. In graph (C), two spectra are displayed for sample H—one for the formed crystal and one for the free smooth surface. (D) Optical micrograph of a bulk sample stored for 100 days at 10 °C. The sample was then gently broken; the micrograph shows two pieces on the cross-section. The pale/white parts represent the surface crystalline layer formed by the GC growth mechanism.

