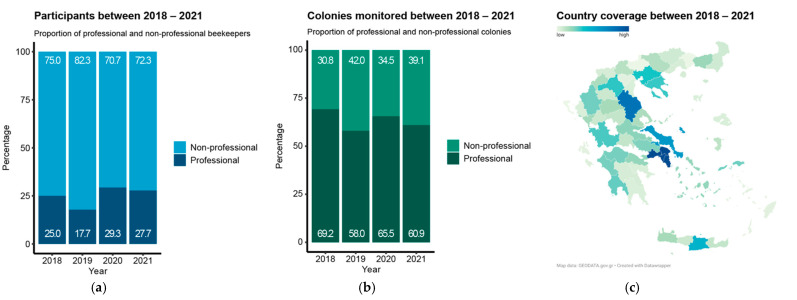
Figure 1.
Constant distribution of the types of participants and monitored colonies across the years all over Greece: (a) stack bar plots showing the proportion of participants and; (b) monitored colonies in relation to their socio-professional situation (professional beekeepers > 150 hives); (c) map coverage of total participation across four years.

