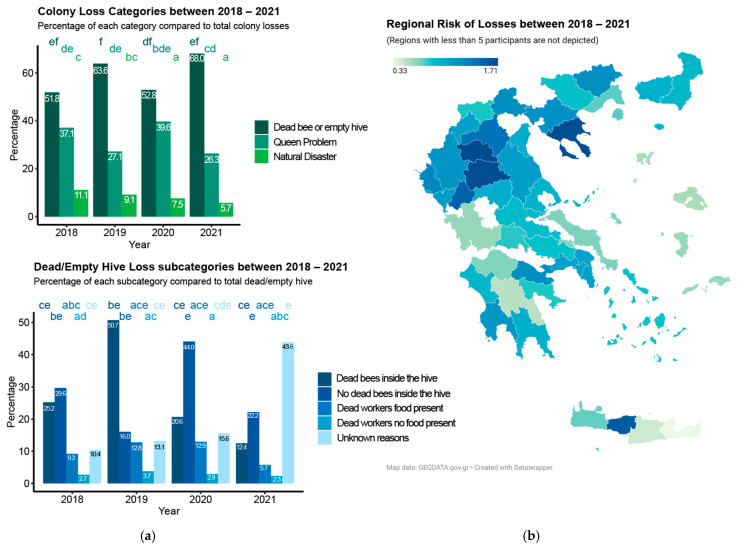
Figure 2.
Main reasons for the loss of colonies and identification of regions at risk in Greece: (a) bar plots showing percentage of loss per main category (upper panel) and per sub-category (lower panel) per year; (b) map showing the risk of losses over the four years (the map shows beekeeper answers only for regions with a minimum of five answers over the four years). The statistical significance of the changes observed within the four years was performed using a generalized linear model with a negative binomial distribution. Multiple comparisons were performed using Tukey tests. Letters on top of each bar indicate the significance of the comparisons. When two bars share the same letter, their differences are not significant.

