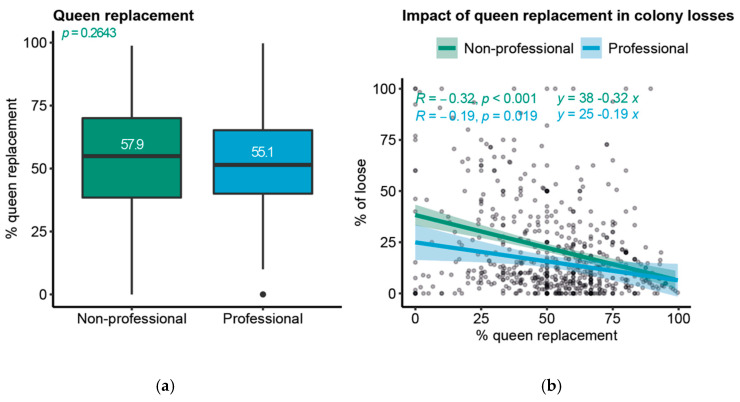
Figure 3.
Queen replacements reduce colony losses: (a) box plot showing the % of queen replacement in relation to the beekeeper professional categories, p-value indicates the significance of unpaired two samples t-test; (b) scatter plot showing the relation between hive losses and queen replacement (n = 618 beekeepers, p-values indicate the significance of Pearson’s correlation coefficient).

