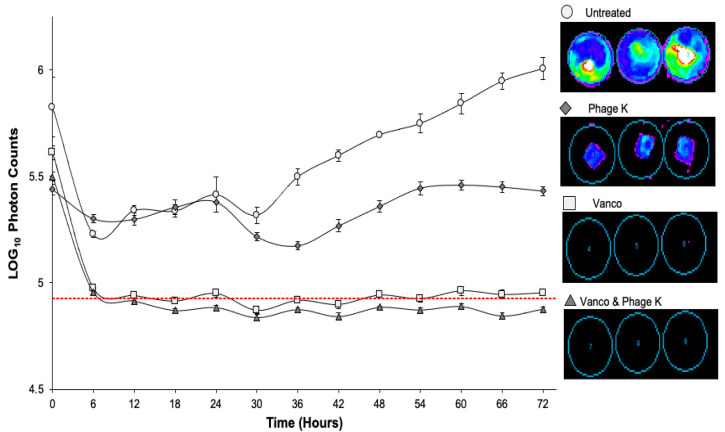
Figure 5.
Bioluminescent activity of dynamic biofilms over 72-h treatment period. Vertical bars represent standard error of the mean. Dotted red line shows limit of bioluminescence detection of imaging system. Treatments included: untreated; vancomycin; staph phage K; combination of vancomycin and staph phage K. Luminescent intensity is displayed on a rainbow color scale with violet being least intense and red being most intense. Minimum and maximum intensities are shown to be 300 and 3000, respectively.

