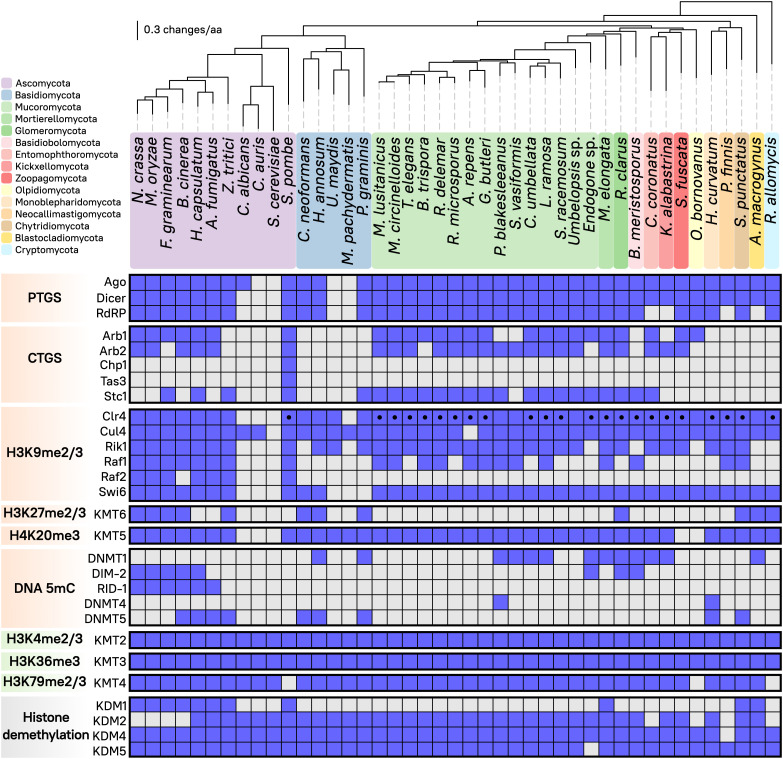
Fig. 1.
Distribution of RNAi components and chromatin-modifying methyltransferases in fungi. The matrix displays presence (blue) or absence (gray) of different epigenetic regulatory complexes and their corresponding proteins (Left) across the fungal kingdom (Top). Predicted N-terminal chromodomain in Clr4 methyltransferase is depicted (black dot). RNAi components involved in posttranscriptional or cotranscriptional silencing (PTGS or CTGS, respectively, orange), methyltransferases involved in either transcriptional activation (green) or repression (orange), as well as histone demethylases (gray) are shown. The fungal phylogenomic tree contains 43 species selected as representatives from each major color-coded phylum and a robust sampling of Mucoromycota and other fungal pathogens, showing evolutionary distance as substitutions per amino acid (solid black lines).

