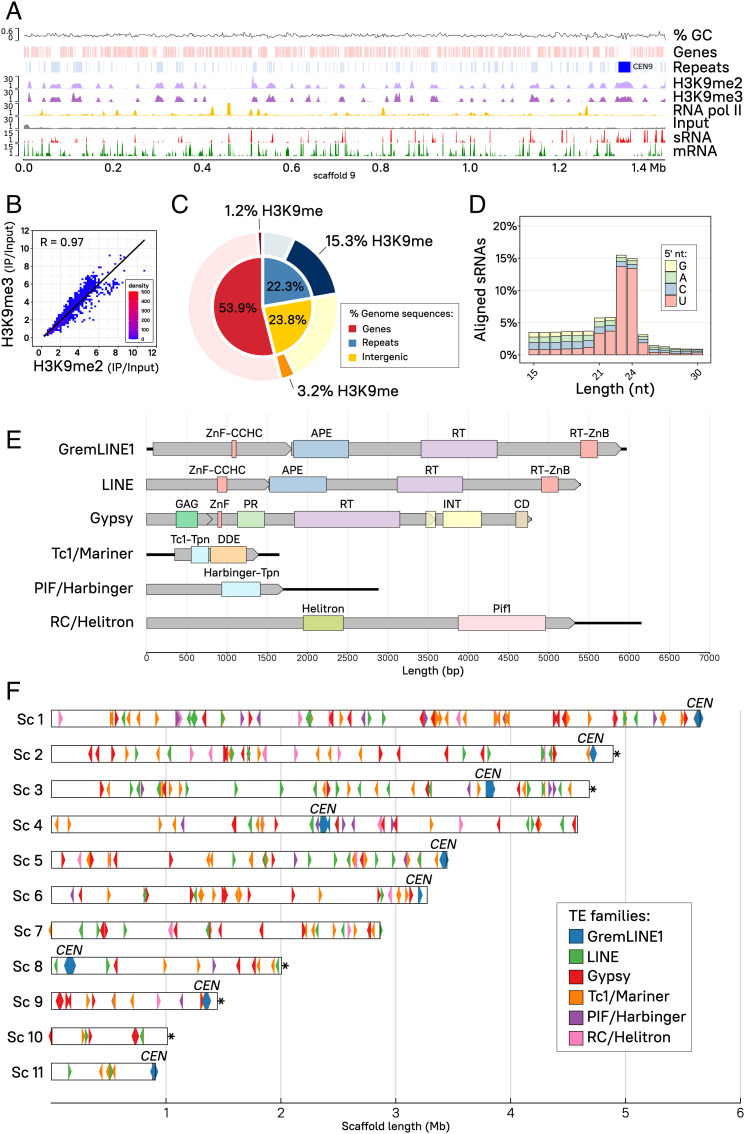
Fig. 2.
H3K9me heterochromatin and RNAi are coincident at transcriptionally silent, repeated sequences. (A) H3K9me2 (light purple) and -me3 (dark purple) and RNA polymerase II (RNA pol II, gold) enriched distribution is shown across scaffold 9. Enrichment coverage is computed as the ratio of immunoprecipitated (IP) DNA/Input DNA reads, previously normalized as log2 CPM. Input control coverage (gray) is shown as normalized log2 CPM for reference. Transcripts (mRNA, green) and sRNA (red) coverages correspond to log2 CPM. Genes (light red) and repeated sequences (light blue) including pericentric regions (dark blue) are displayed, as well as guanine-cytosine (GC) content coverage as a percentage. (B) Dot plot and Pearson’s correlation coefficient (R, black line) of H3K9me2 (x-axis) and -me3 (y-axis) average log2 CPM enrichment values are plotted as 10-kb regions representing the whole genome. Overlapping dots are color-coded as a density scale. (C) Proportion of gene, repeated, and intergenic sequences are shown color-coded as percentage of total base pairs in the genome (inner pie chart). The proportion of H3K9-methylated base pairs in the same categories is highlighted (darker shade, outer pie chart) from the remaining nonmethylated base pairs (lighter shade, outer pie chart). (D) The percentage of small RNA aligned reads according to length and 5′-end nucleotide distribution (color-coded) is depicted. (E) Schematic view of the six most abundant TE families identified in the genome, showing total length (bp) of the elements (solid black lines), ORFs (gray rectangular arrows), and predicted protein domains (color-coded rectangles) abbreviated as follows: Zinc finger, CCHC-type (ZnF-CCHC); Endonuclease/exonuclease/phosphatase superfamily (APE); Reverse transcriptase domain (RT); Reverse transcriptase zinc-binding domain (RT-ZnB); Retrotransposon GAG domain (GAG); Aspartic peptidase domain superfamily (PR); Integrase zinc-binding domain and catalytic core (INT); Chromodomain (CD); Transposase, Tc1-like (Tc1-Tpn) and DDE domain (DDE); Harbinger transposase-derived nuclease domain (Harbinger-Tpn); Helitron helicase-like domain (Helitron); and DNA helicase Pif1-like (Pif1). (F) Genomic distribution of the six most abundant TE families shown as color-coded rectangular arrows to indicate transcription direction (element length is scaled to the rectangle width, not including the arrow point). Centromeric (CEN) and telomeric (*) regions are designated in the plot. The first 11 out of 24 scaffolds (>94% of the genome) containing all of the nine centromeres and their length (Mb) are shown for reference.

