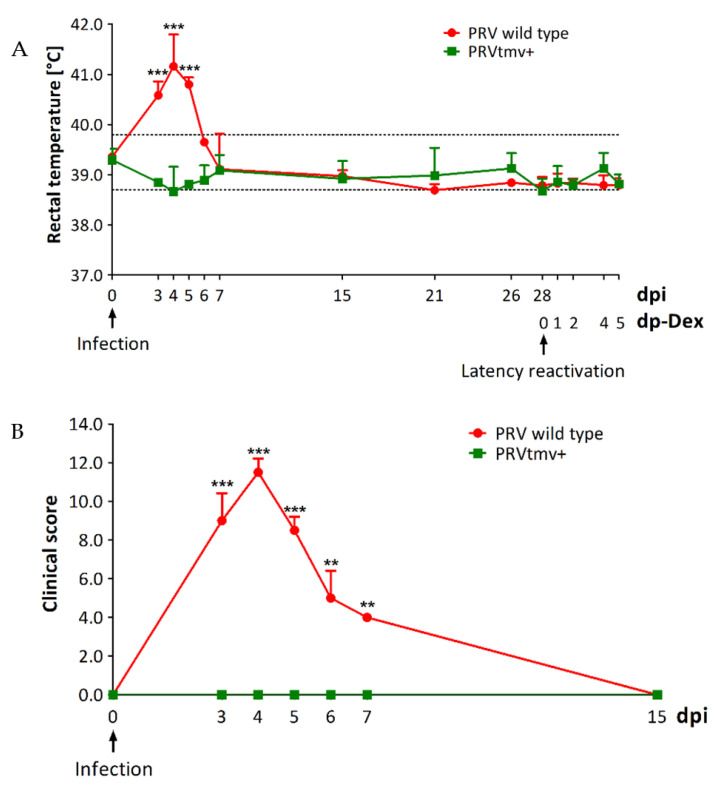
Figure 2.
Clinical assessments. (A) Rectal temperature of pigs following primary infection and Dex-induced latency reactivation. Shown is the mean temperature of each treatment group with standard deviation (SD). The data represent the mean + SD. There were significant differences in rectal temperature between PRV wild-type (wt) and PRVtmv+ groups. Two-way ANOVA followed by Bonferroni post-tests to compare replicate means by row; *** p < 0.001 between PRV wt and PRVtmv+ group. (B) Clinical scores in pigs after infection. The scoring criteria are listed in Table 1. Shown is the mean of each group with SD. Two-way ANOVA followed by Bonferroni post-tests to compare replicate means by row; ** p < 0.01 and *** p < 0.001 between PRV wt and PRVtmv+ groups. dpi—days post-infection; dp-Dex—days post-dexamethasone injection.

