Fig. 1.
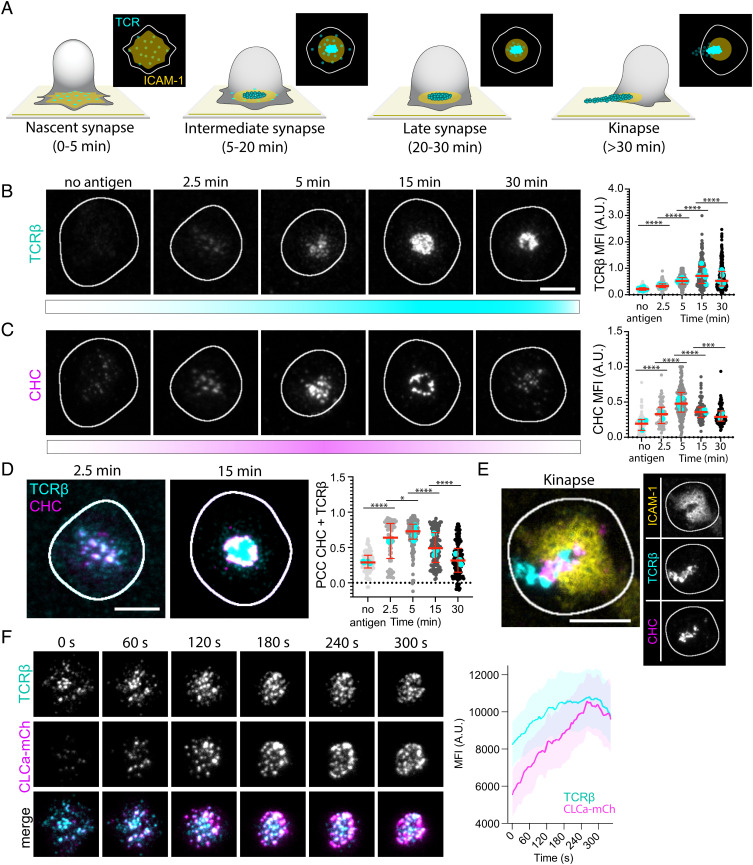
Clathrin is recruited to the IS. (A) Schematic of the different maturation stages of the IS formed between a T cell and an SLB. ICAM-1 (yellow) forms the adhesion ring, and TCRβ microclusters (cyan) reach the center of the contact area where some are released as synaptic ectosomes that are left behind as symmetry breaking allows the T cell to relocate. (B and C) Representative TIRF micrographs of AND mCD4 T cells incubated on SLBs either with ICAM-1-AF405 (200/µm2) alone for 5 min or with ICAM-1-AF405 + I-Ek-MCC (20/µm2) for 2.5, 5, 15, and 30 min and labeled with anti-mouse TCRβ and anti-CHC. Ncells ≥ 62 per time point. (Scale bar, 5 µm.) The Right panels are quantifications of the MFI of TCRβ and CHC across the synaptic interface. Lines are median value ± IQR, and cyan dots are average values from individual experiments. (D) Representative TIRF micrographs emphasizing the colocalization between CHC (magenta) and TCRβ (cyan) at 2.5 min and 15 min. The Right panel is quantification of the PCC between CHC and TCRβ across the synaptic interface from the micrographs in B–D. (E) Representative TIRF micrograph of a kinapse formed by an AND T cell incubated for 30 min on an SLB with ICAM-1-AF405 (yellow) + IEk-MCC as before. Note how CHC (magenta) is overlapping with TCRβ (cyan) in the region where the pSMAC is broken. (F) Representative time frames from a movie of a live mCD4 AND T cell expressing CLCa-mCherry (magenta) while forming an IS on an SLB with ICAM-1-AF405 (200/µm2) and I-Ek-MCC (50/µm2). The TCR is labeled with anti-TCRβ (cyan). The Right panel is mean temporal fluorescence intensity traces ± SEM of TCR microclusters with overlapping CLCa-mCherry fluorescence. Ncells = 5.

