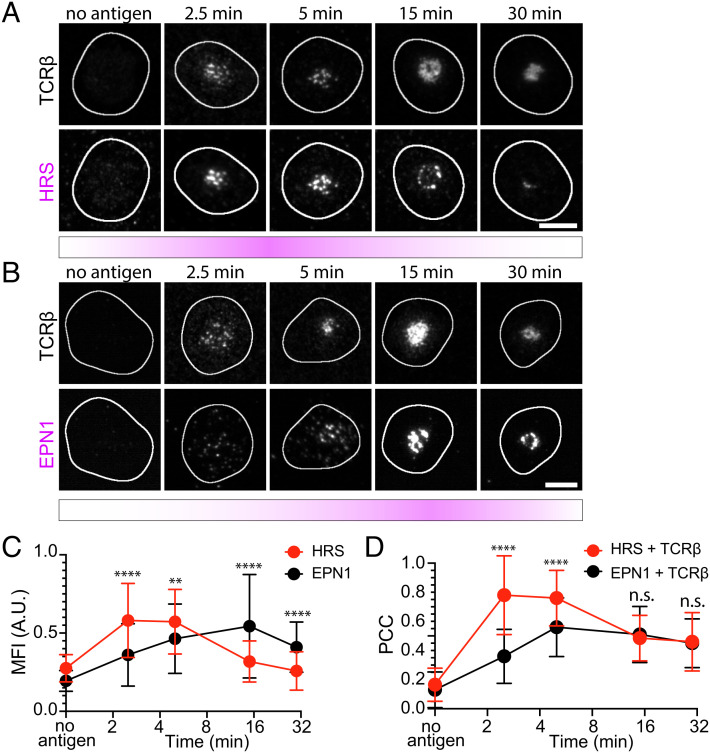
Fig. 2.
HRS and EPN1 are recruited to the IS at different stages of synapse maturation. (A) Representative TIRF micrographs of AND mCD4 T cells incubated on SLBs either with ICAM-1-AF405 (200/µm2) alone for 5 min or with ICAM-1-AF405 + I-Ek-MCC (20/µm2) for 2.5, 5, 15, and 30 min and labeled with anti-mouse TCRβ and anti-HRS. Ncells ≥ 65 per time point. (Scale bar, 5 µm.) (B) Representative TIRF micrographs of AND mCD4 T cells incubated on SLBs either with ICAM-1-AF405 (200/µm2) alone for 5 min or with ICAM-1-AF405 + I-Ek-MCC (20/µm2) for 2.5, 5, 15, and 30 min and labeled with anti-mouse TCRβ and anti-EPN1. Ncells ≥ 60 per time point. (Scale bar, 5 µm.) (C and D) Direct comparison of the temporal MFI of HRS and EPN1 at 2.5, 5, 15, and 30 min relative to the max intensity of each protein at 5 min (C), and the temporal PCC between HRS and TCRβ compared to the temporal PCC of EPN1 and TCRβ (D) from the micrographs in A and B. Lines are median ±SD.

