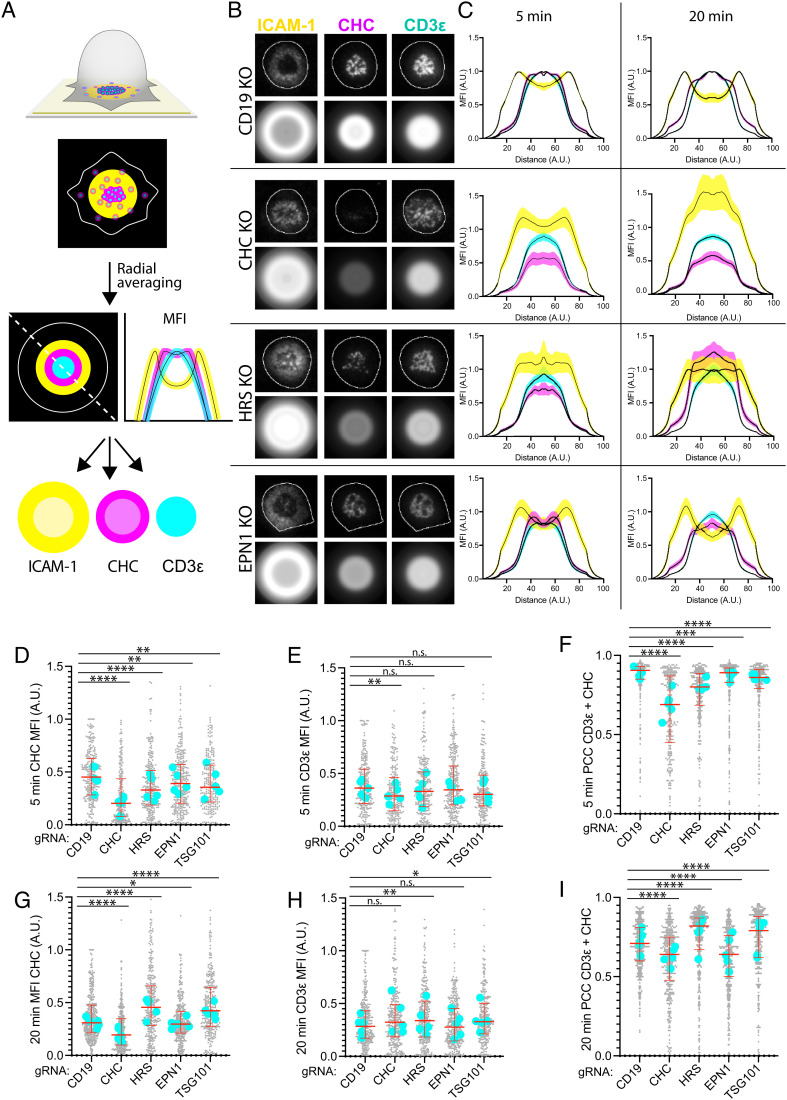
Fig. 4.
HRS and EPN1 recruit clathrin to the IS in a sequential manner. (A) Schematic of radial averaging of micrographs of the IS formed between a T cell and an SLB. ICAM-1 is labeled yellow, TCR cyan, and CHC magenta. The dashed line and the line plots represent a diagonal measurement of the positional MFI of the individual channels. (B) Representative TIRF micrographs and corresponding radial averages of hCD4 CD19, CHC, HRS, and EPN1 KO T cells incubated on SLBs with ICAM-1-AF405 (200/µm2) and anti-CD3ε UCHT1-AF488 (30/µm2) for 5 min. (C) Radial averages of hCD4 CD19, CHC, HRS, and EPN1 KO T cells incubated on the SLBs from B for 5 and 20 min. The MFI represents MFI from five individual experiments ± SEM. (D–I) Quantification of the MFI of CHC (D and G), CD3ε (E and H), and the PCC between CHC and CD3ε (F and I) across the synaptic interface from hCD4 CD19, CHC, HRS, EPN1, and TSG101 KO T cells incubated on the SLBs from B for 5 and 20 min. Ncells ≥ 219 per condition. Lines are median ± IQR, and cyan dots are median values from individual experiments.

