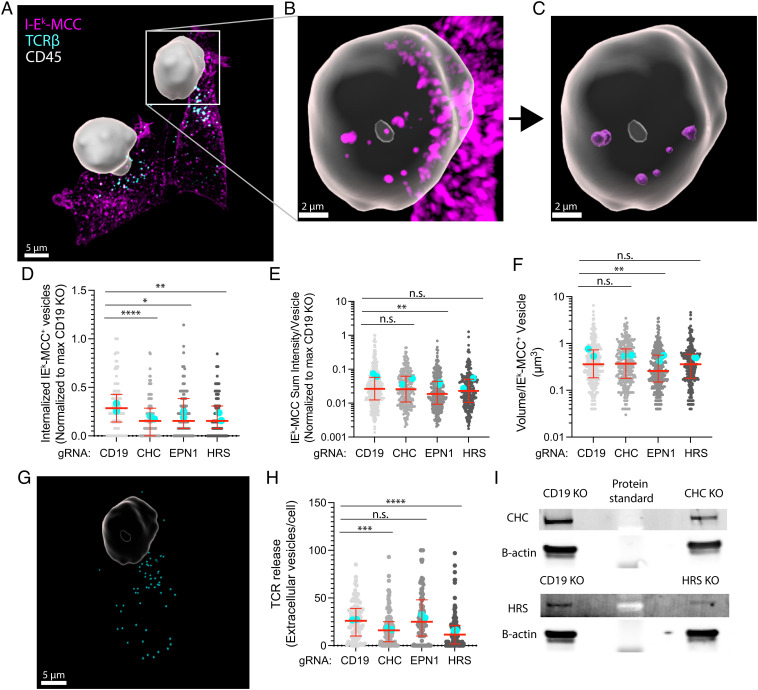
Fig. 6.
Clathrin, HRS, and EPN1 regulate pMHC–TCR trans-endocytosis. (A–C) Imaris 3D reconstructed micrographs of spinning disc confocal Z-stacks with a step size of 250 nm of mCD4 AND T cells incubated with CHO-I-Ek APCs for 30 min and immunolabeled with anti-CD45 (white), anti-TCRβ (cyan), and anti-I-Ek-MCC (magenta). The CD45 signal has been used to create a mask of the T cell. (D–F) Quantification of the number of internalized I-Ek-MCC–positive vesicles per cell (D), sum I-Ek-MCC fluorescence intensity per vesicle (E), and volume per I-Ek-MCC–positive vesicle (F) following KO of CD19, CHC, EPN1, or HRS in mCD4 AND cells incubated for 30 min on CHO-I-Ek APCs. Ncells ≥ 111 per condition. Lines are median value ± IQR, and cyan dots are average values from individual experiments. (G) Segmented TCR-positive vesicles (cyan) released from one of the mCD4 T cells from (A). (H) Quantification of the number of released TCR-positive vesicles per cell. (I) A representative WB of the protein levels of CHC, HRS, and β-actin from one experiment following CHC and HRS KO.

