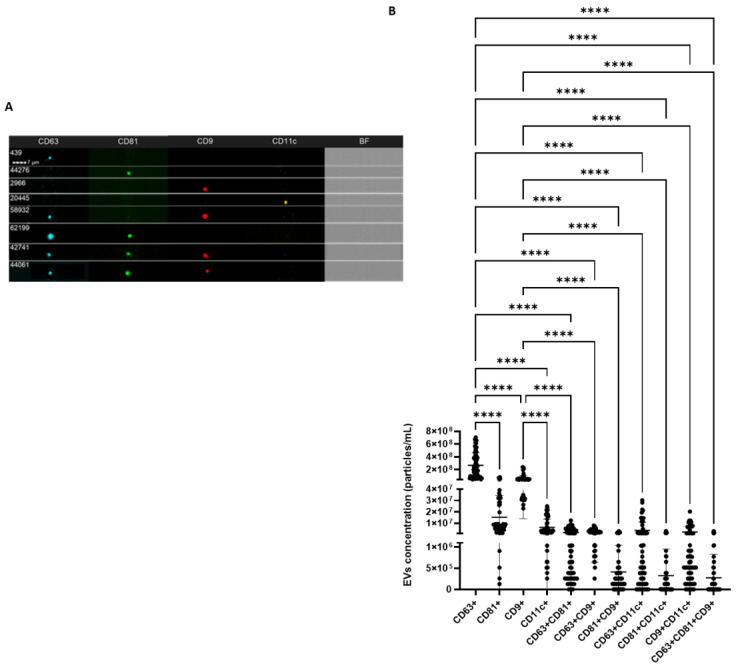
Figure 3.
(A) shows representative captured particles with a positive signal to the tetraspanins CD63, CD81, CD9, and the integrin CD11c. (B) Graphs reporting the EV concentration (mean ± SD) of single- double- and triple- positive EVs to the surface markers (n = 60). BF: Brightfield; **** p < 0.0001.

