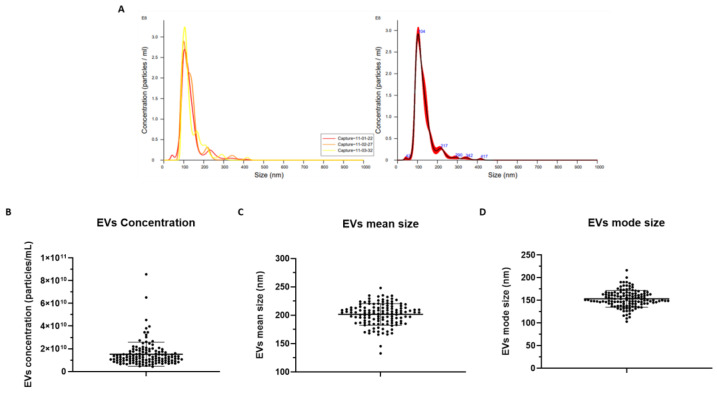
Figure 4.
A representative graph of NTA measurement through NanoSight NS300 (Malvern Panalytical) obtained by NTA Software version 3.4, reporting the values of particle concentration in relation to their size. On the left, the three curves show the data captured in three 1 min videos for the same sample. On the right, the merged data (A). Graphs representing the EV mean concentration ([EVs/mL] ± SD) (B), EV mean size (nm ± SD) (C), and EV mode size (nm ± SD) (D) (n = 130).

