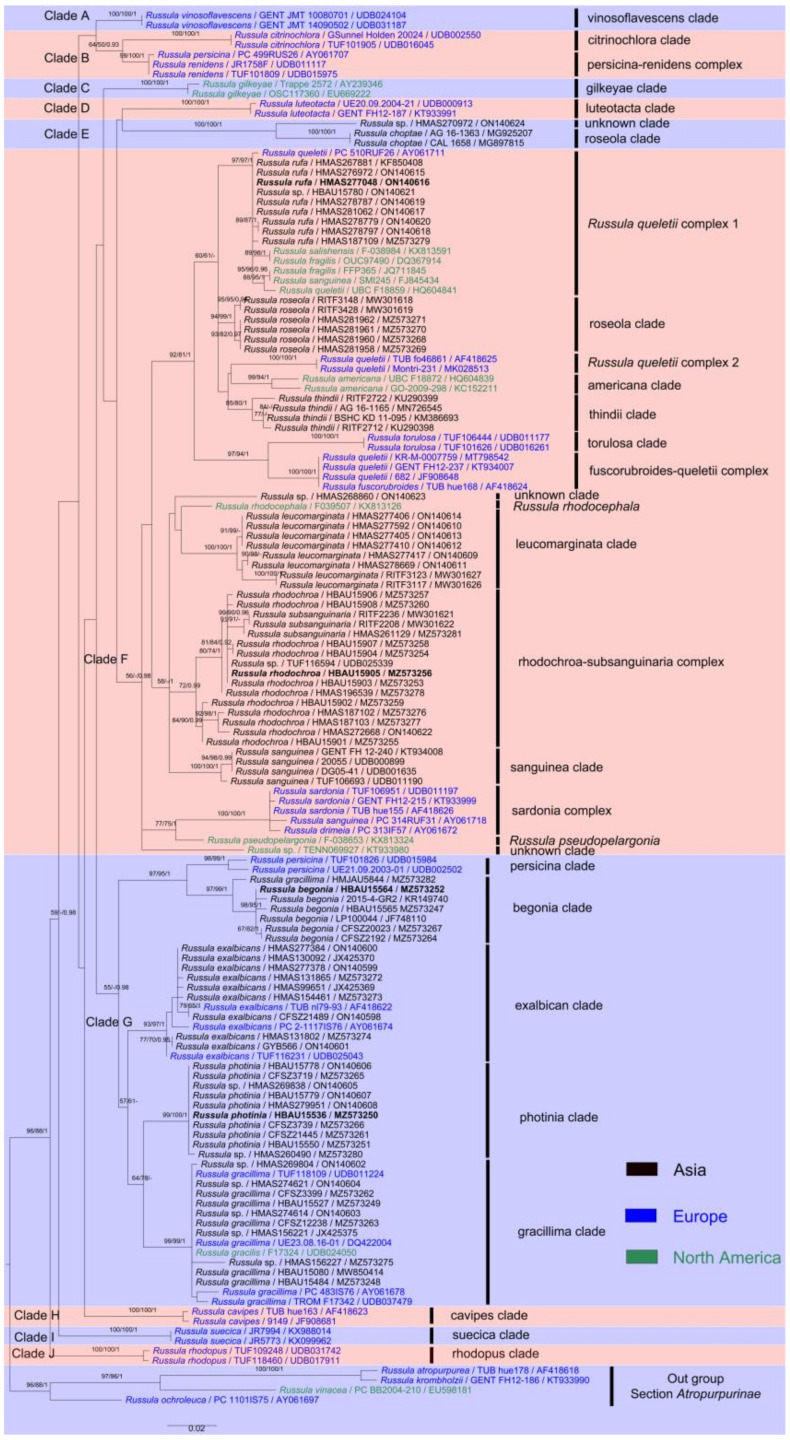
Figure 1.
The ITS phylogenetic topology derived from maximum likelihood analysis. Bootstrap values (≥50%) of maximum likelihood (MLBS) and maximum parsimony (MPBS) analyses, together with posterior probability (PP) values (≥0.9) of Bayesian analysis, are presented above the branches as (MLBS/MPBS/PP). Holotypes of new species are shown in bold.

