Fig. 4.
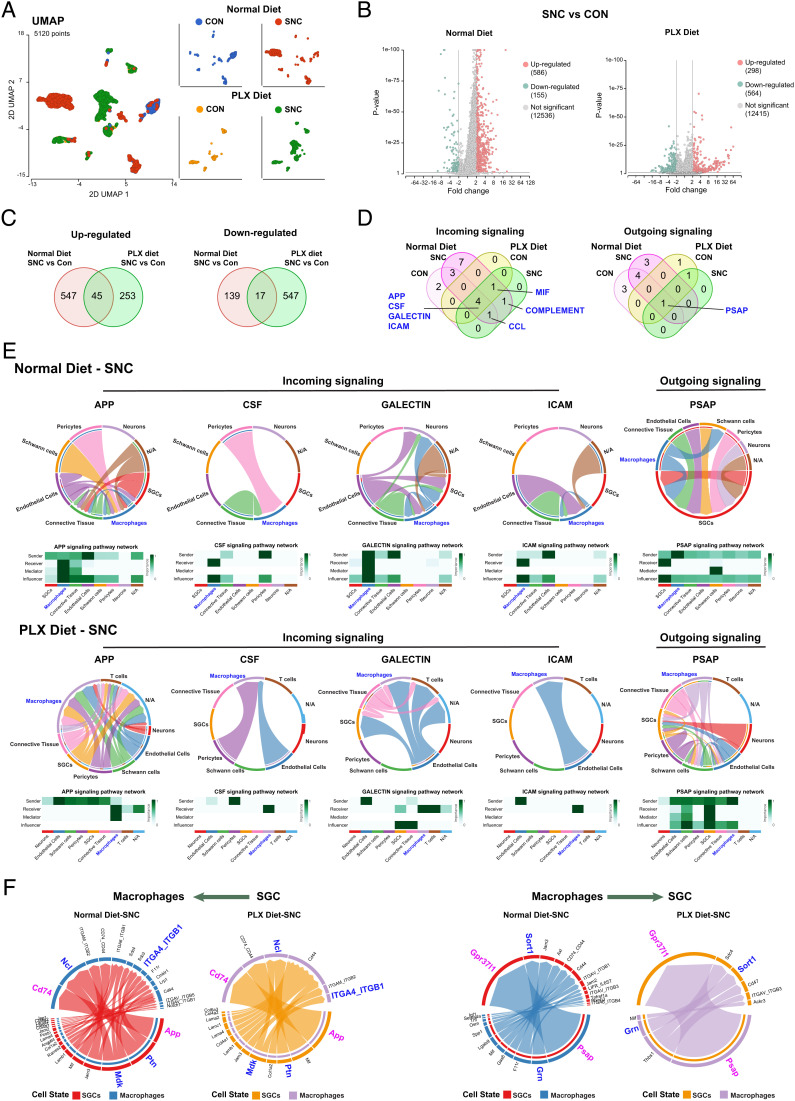
Cell communications between macrophages and other cell types in DRG. (A) UMAP of transcriptional profiles of macrophage in the control side (CON) and injured side (SNC) of DRGs at 3 d post injury with either normal diet or PLX diet treatment period of injury. N (cell number) = 820 (Normal diet-CON), 1,779 (Normal diet-SNC), 509 (PLX diet-CON), 2,012 (PLX diet-SNC), respectively. (B) Volcano plot showing DEGs (FDR < 0.05 and |fold-change| > 2) between macrophage with injured (SNC) and control (CON) sides of DRGs at 3 d.p.i. under normal diet (Left) and PLX diet (Right) treatment period of SNC. The numbers of DEGs are indicated in parentheses. (C) Venn diagram of up-regulated (Left) and down-regulated (Right) DEGs between injured to control under normal diet treatment was compared with PLX diet treatment. (D) Venn diagram of incoming (Left) and outcoming (Right) signalings in DRGMacs in the control side (CON) and injured side (SNC) of DRGs at 3 d post injury with either normal diet or PLX diet treatment period of injury. (E) Chord diagram inferred the APP, CSF, GALECTIN, ICAM macrophage incoming signaling and PSAP macrophage outgoing signaling under normal diet treatment (Upper) or PLX diet treatment (Bottom) in SNC reconstructed with CellChat. The size of the width of various colors in the periphery indicates probability/intensity value of interaction (intensity is the sum of probability values). Heatmaps quantify the role of each cluster as a sender, receiver, mediator, and influencer. (F) Chord diagram inferred the legend–receptor pairs between macrophage and SGC under normal diet treatment or PLX diet treatment in SNC reconstructed with CellChat. SGCs to macrophages (Left); macrophage to SGCs (Right). The size of the width of various colors in the periphery indicates probability/intensity value of interaction (intensity is the sum of probability values).

