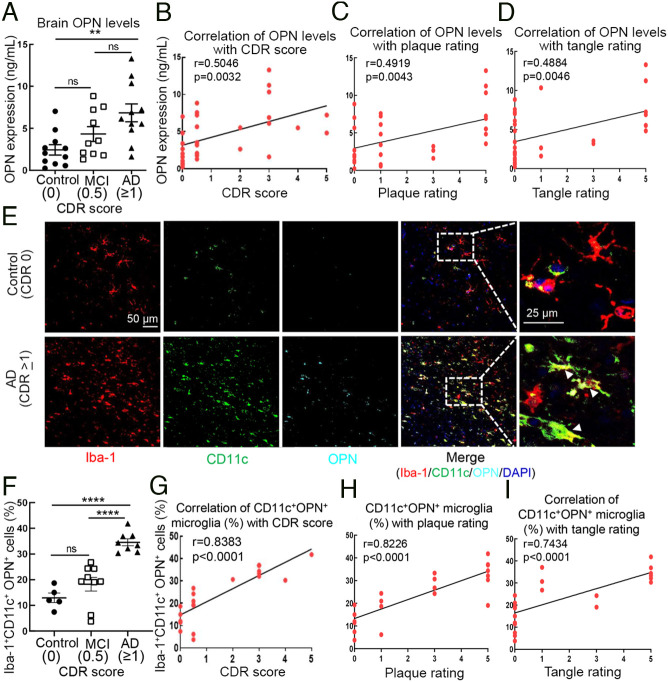
Fig. 4.
Increased microglial OPN production correlates with AD severity in human AD brains. (A) Analysis of OPN protein expression in brain (middle frontal gyrus) homogenates from AD patients (CDR ≥ 1, n=11) with mild cognitive impairment (MCI, CDR 0.5, n=10) and cognitively normal controls (CDR 0, n=11). **P < 0.01, ns: not significant by one-way ANOVA with Bonferroni’s multiple comparisons test. (B) Pearson’s correlation analysis of OPN expression levels in brain tissues from AD patients with CDR scores (CDR ≥ 1, n=11), MCI patients (CDR 0.5, n=10), and controls (CDR 0, n=11). r=0.5046, P=0.0032. (C and D) Pearson’s correlation analysis of brain OPN concentrations correlated with neuritic plaque rating (r=0.4919, P=0.0043) and tangle rating (r=0.4884, P=0.0046). (E and F) Representative immunofluorescent images from middle frontal gyrus of AD patients and normal controls stained for Iba-1 (microglia, red), CD11c (green) and OPN (cyan) are indicated by white arrows. Percent of CD11c+OPN+ microglia in brains of AD patients (CDR ≥1, n=8) compared with MCI (CDR 0.5, n=9) and control subjects (CDR 0, n=5). Each dot represents the average percentage of CD11c+OPN+ microglia over total Iba-1+ cells in 10 to 12 fields of each brain sample. (Scale bar, 25 μm.) ****P < 0.0001, ns: not significant by one-way ANOVA with Bonferroni’s multiple comparisons test. (G) Pearson’s correlation analysis of the percentage of CD11c+OPN+ microglia in human brain tissues correlated with CDR scores in AD patients (CDR ≥1, n=8), MCI patients (CDR 0.5, n=9) and controls (CDR 0, n=5). r=0.8383, P < 0.0001. (H and I) Pearson’s correlation analysis of the percentage of CD11c+OPN+ microglia in human brain tissues correlated with neurite plaque rating (r=0.8226, P < 0.0001) and tangle rating (r=0.7434, P < 0.0001). All data are presented as mean ± SEM.

