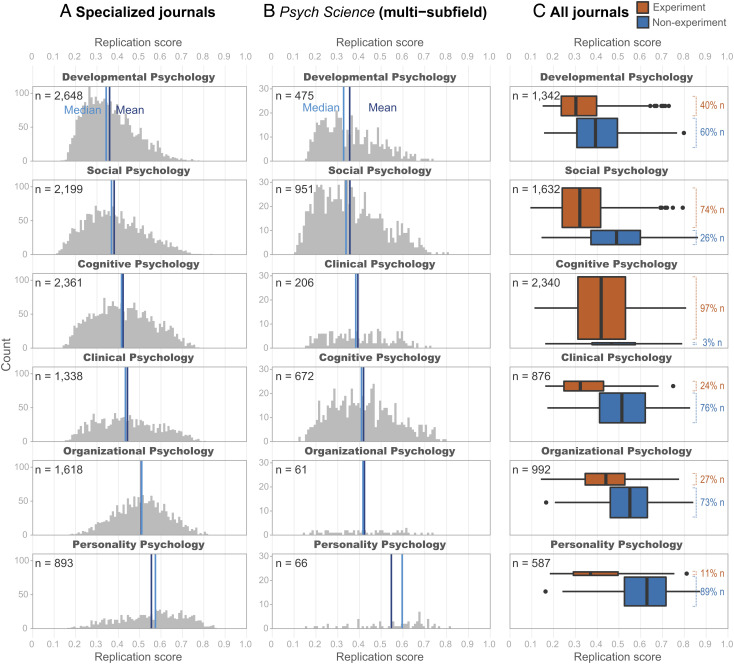
Fig. 2.
Comparing Replicability for Six Psychology Subfields and Between Experimental and Non-experimental Research. Panel A shows the average replicability estimated for papers published in specialized journals, categorized into six subfields. The light blue vertical line represents the median for each subfield, and the dark blue line is the mean. Panel B also illustrates predicted replication scores, but the papers are all published in a single multi-subfield journal, Psychological Science. The subfield replicability rankings were largely consistent with the ones in specialized journals, except that the order of Cognitive and Clinical Psychology was reversed. To explain the subfield patterns, Panel C further breaks down the average replication scores by research methods for each subfield, comparing replicability between experimental (orange boxes) and non-experimental research (blue boxes). The proportion of experimental vs. non-experimental research in each subfield is marked as k% of total papers (e.g., 40% of Developmental Psychology papers are experimental). Experimental research on average has lower replication scores, and the proportion of experimental research partially explains the subfield differences in average replicability.

