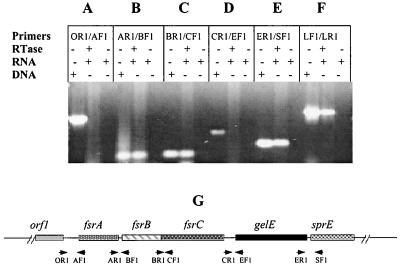
FIG. 4.
RT-PCR analysis of gene cotranscription in fsr/gelE loci. Every three lanes divided by a solid line represents one set of experiments using the same primers. In each set, the first lane shows PCR using chromosomal DNA as the template, which serves as a positive control for PCR, the second lane shows an RT-PCR with (+) RNA and reverse transcriptase (RTase) but without (−) chromosomal DNA; the third lane shows an RT-PCR with RNA but without RTase and chromosomal DNA, which serves as a control to determine the contamination of DNA in RNA samples. (A to E) RT-PCR analysis using primers covering the intergenic regions between orf1 and fsrA, fsrA and fsrB, fsrB and fsrC, fsrC and gelE, and gelE and sprE, respectively. (F) RT-PCR using two internal primers (lytF1 and lytR1) of E. faecalis autolysin, a positive control for RT-PCR. Primers: OR1, orfRTR1; AF1, fsrARTF1; AR1, fsrARTR1; BF1, fsrBRTF1; BR1, fsrBRTR1; CF1, fsrCRTF1; CR1, fsrCRTR1; EF1, gelERTF1; ER1, gelERTR1; SF1, sprERTF1; LF1, lytF1; LR1, lytR1. (G) Diagram illustrating the positions of the primers used in the RT-PCR analysis. Solid line, chromosomal DNA; boxes, genes; arrows, primers.

