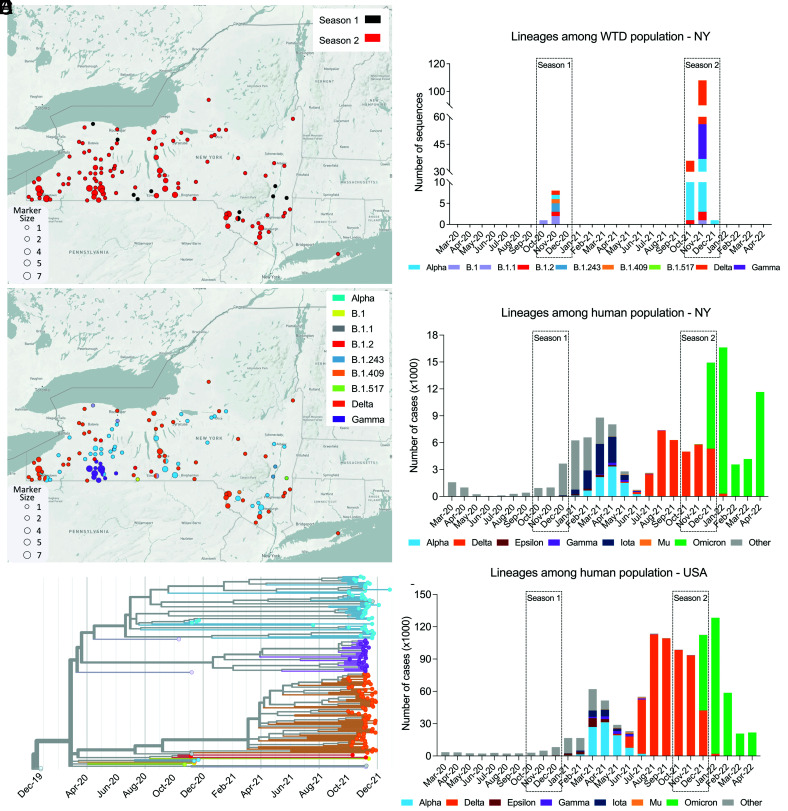
Fig. 3.
Distribution of SARS-CoV-2 lineages across NY and phylogenetic relatedness of viral genomes. (A) Map of the State of New York (NY) and geographic distribution of the 164 samples from which complete or near-complete SARS-CoV-2 genome sequences were obtained and according to the season is presented (9 and 155 genomes from Season 1 and Season 2, respectively). (B) Map of NY and geographic distribution of the SARS-CoV-2 lineages detected in free-ranging WTD in this study. (C) Phylogenetic tree showing 164 SARS-CoV-2 genomes obtained from WTD in NY across time. (D) The distribution of SARS-CoV-2 lineages among the WTD population in NY during Season 1 and Season 2. (E) Monthly distribution of SARS-CoV-2 human cases (March 2020 to April 2022) from NY and (F) the United States. The colored stacked bars represent number of each SARS-CoV-2 lineage.

