Fig. 1.
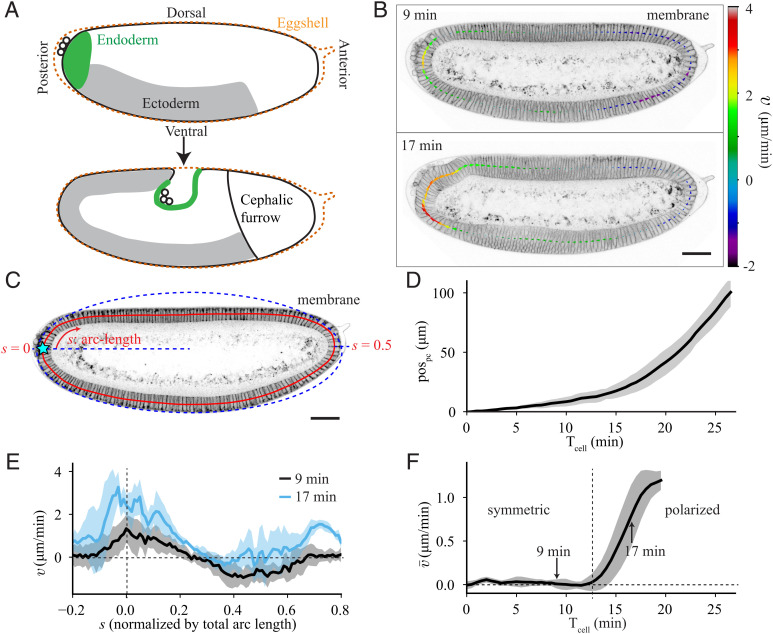
Quantification of tissue flow during early Drosophila morphogenesis. (A) Cartoons of Drosophila embryo (Top) at an early stage, during cellularization, and (Bottom) approximately 30 min later. (B) Sagittal plane of an embryo imaged with membrane marker GAP43::mScarlet at 9 min and 17 min after the cellularization front passes the nuclei in the dorsal posterior (Tcell = 0). The arrows show the tangential velocity of the tissue along the midline, extracted using particle image velocimetry. (C) Two-photon image of the sagittal plane of an embryo imaged with GAP43::mScarlet. The red line denotes the midline of the epithelium. The arc-length (s) increases in the clockwise direction and is normalized to the total length of the midline. The blue dashed line represents an elliptical fit to the apical surface of the epithelium used to determine the location of s = 0 at the posterior pole (Materials and Methods). (D) Quantification of the pole cell position (pospc, defined in Materials and Methods) as a function of time after Tcell = 0, averaged over 6 embryos. (E) Spatial profile of tangential tissue velocity () along the midline at the same times as in C, averaged over 5 embryos. (F) Spatial average of the tangential velocity () as a function of time. Vertical dashed line marks the onset of polarized flow. Average performed over 5 embryos. All scale bars are 50 μm. Error bars represent the SD.

