Fig. 2.
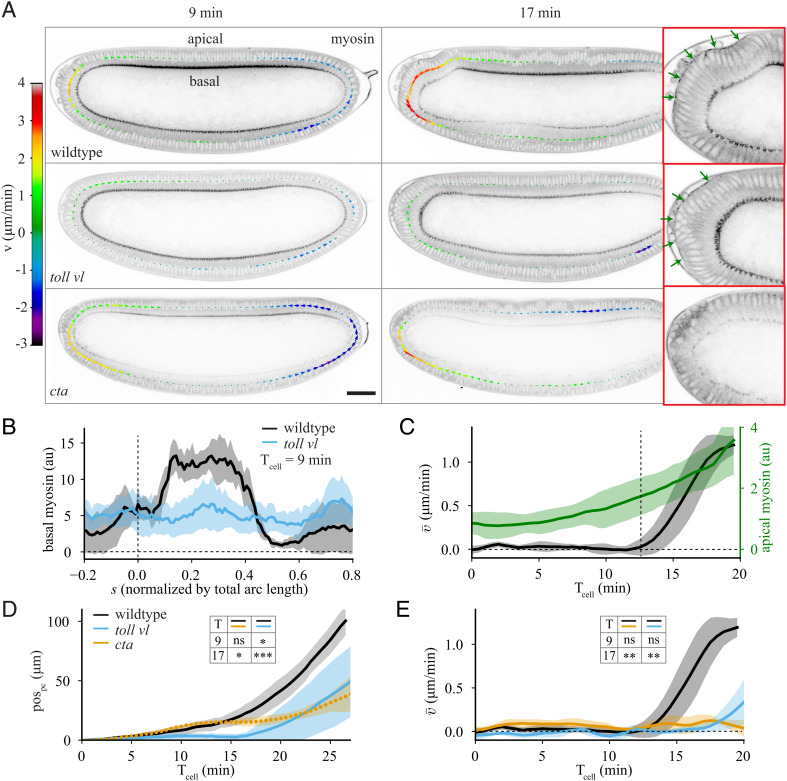
Impact of apical and basal myosin on tissue flow. (A) Sagittal plane of an embryo imaged with Myosin-II (myosin) marker spaghetti squash (sqh)::GFP at 9 min and 17 min after Tcell = 0 for (Top) wildtype, (Middle) toll vl mutant, and (Bottom) cta mutant embryos. The arrows show the tangential velocity of the tissue along the midline. The panels on the right show a zoomed view of the posterior at Tcell = 17 min with apical myosin indicated with green arrows. (B) Spatial profile of basal myosin intensity at Tcell = 9 min for wildtype (black) and toll vl mutant (blue) embryos. Average performed over 5 wildtype and 6 toll vl mutant embryos. (C) Average of apical myosin over the posterior of the embryo (−0.1 < s < 0.15; green) and spatial average of the tangential velocity as a function of time (black) for 5 wildtype embryos. Vertical dashed line marks the onset of polarized flow. (D) pospc as a function of time for wildtype, toll vl, and cta embryos. Average performed over 6 wildtype, 7 toll vl, and 7 cta embryos. (E) Spatial average of the tangential velocity as a function of time. Average performed over 5 wildtype, 6 toll vl, and 5 cta embryos. All scale bars are 50 μm. Error bars represent the SD. Insets in D and E show results of two-tailed unpaired t tests comparing wildtype, toll vl, and cta at Tcell = 9 and 17 min. ns, not significant; *P <0.05; **P < 0.01; ***P < 0.001.

