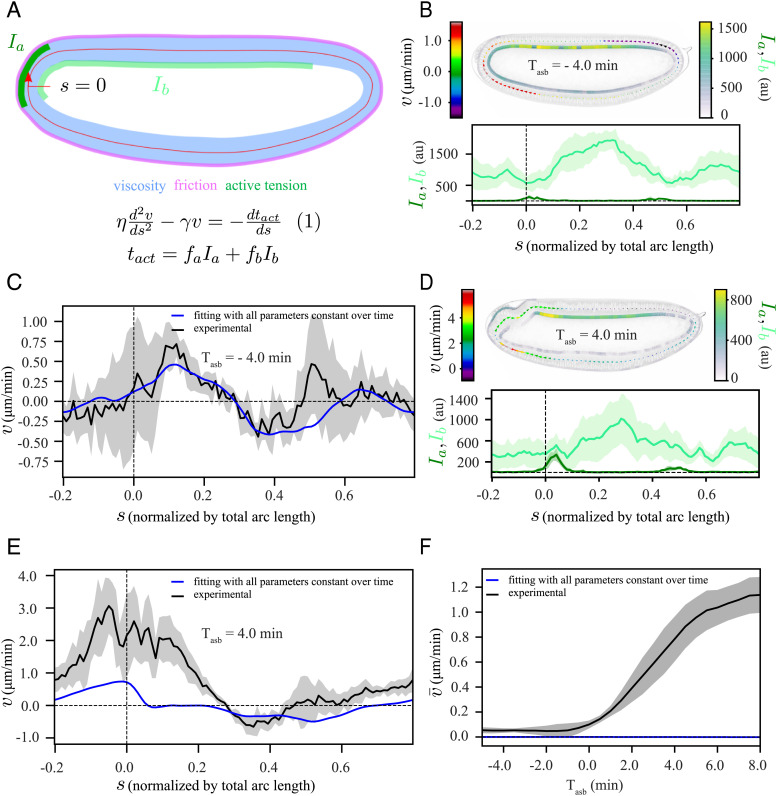
Fig. 3.
A model based on an active tension mechanism explains the symmetric flow. (A) Schematic representation of our modeling framework, equation (1), in which the epithelium is considered as a viscous fluid ( blue) with homogeneous friction ( pink) with the surroundings, along with domains of apical myosin (Ia, dark green) and basal myosin (Ib, light green) as contractile elements. The tissue is approximated by a 1D continuous membrane, positioned along the midline of the epithelium (red line). At any given position, s, the tangential component of the velocity () fulfills equation (1). (B and D) (Top): a representative time frame with a heatmap of , Ia and Ib, (Bottom): the corresponding spatial profiles of Ia and Ib. (B) from the symmetric phase at Tasb = −4 min; (D) from the polarized phase at Tasb = 4 min. (C and E) Simultaneous fit (blue) of equation (1) to the experimentally measured (black) for time points between Tasb = −5 min and Tasb = 8 min, with all parameters constant over time (SI Appendix). (C) Tasb = −4 min, (E) Tasb = 4 min. (F) Temporal profile of spatially averaged velocity () in experiment (black) and from our simultaneous fit (blue). The shaded regions associated with experimental data are the SD, computed over six embryos.

