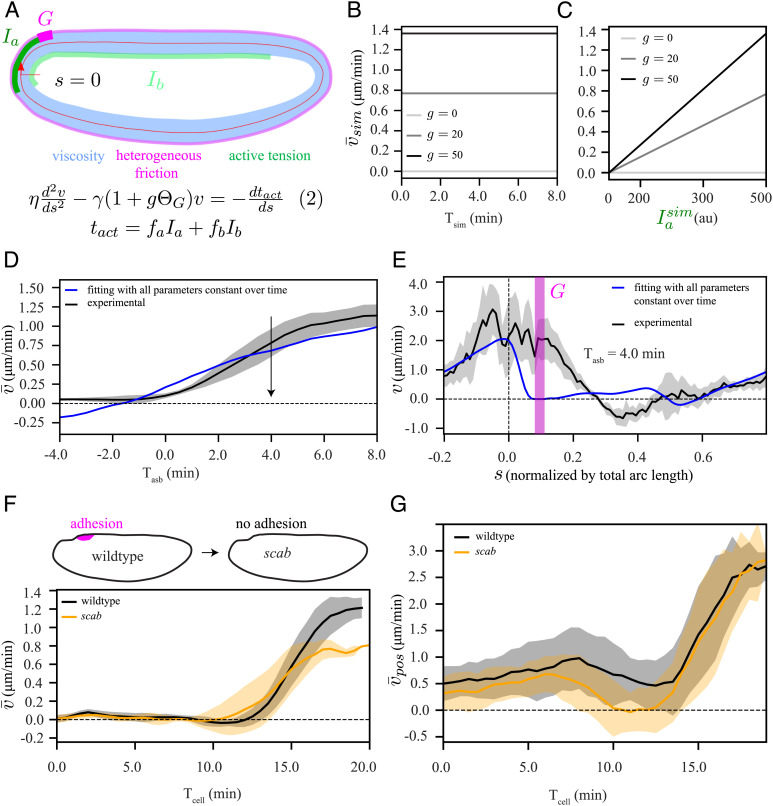
Fig. 4.
Adhesion (or heterogeneous friction)-active tension coupling based model cannot explain the polarized flow. (A) Schematic representation of our model, equation (2), which is similar to equation (1) in Fig. 3A, but with an additional domain G (magenta) of localized increase in friction by a factor g. (B and C) Elliptic model simulation (SI Appendix, Fig. S5 A and B): (B) temporal profile of the spatially averaged velocity () when myosin intensity () is constant over time, shown for three different values of g, (C) Dependence of on temporal increase in , shown for three different values of g. (D) Experimentally measured temporal profile of spatially averaged velocity (black) and fit of equation (2) (blue), using the same procedure as described in Fig. 3. (E) Spatial fit curve corresponding to panel D at a representative time point during the asymmetric phase (Tasb = 4 min). Chi-squared analysis to evaluate the quality of the fit to the data are reported in Fig. 5I. We also performed a single-sided t test to verify whether the velocity goes to zero in the domain G. The results are shown in SI Appendix, Fig. S5D. (F, Top) Schematic diagram of scab knockout, (Bottom) temporal profile of for wildtype (black) and scab (orange). (G) Temporal profile of spatially averaged velocity , where average was performed only over a posterior domain from s = −0.1 to s = 0.15, for wildtype (black) and scab (orange). The shaded regions associated with experimental data are the SD, computed over six embryos. To compare the wildtype and scab conditions in F and G, we performed two-tailed student t test. The results are shown in SI Appendix, Fig. S5H.

