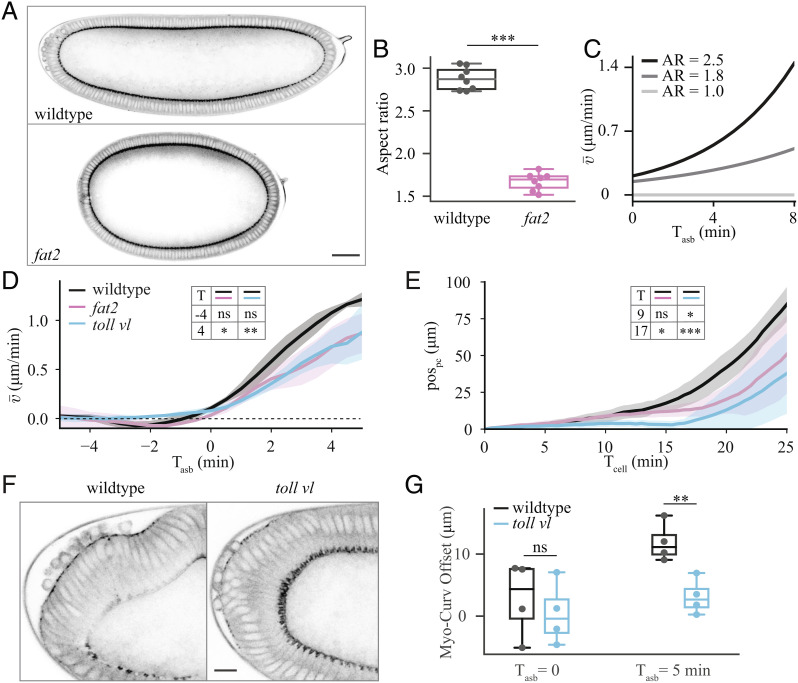
Fig. 6.
Experimental perturbations to challenge model predictions. (A) Sagittal section of wildtype (Top) and fat2 (Bottom) embryos at Tcell = 0, imaged for sqh::GFP. (Scale bar, 50 μm.) (B) Quantification of aspect ratio, defined as the length of the major embryo axis divided by the maximal height of the embryo for eight wildtype and eight fat2 embryos. (C) Average velocity of tissue flow resulting from simulations using our elliptic model with different aspect ratios (AR). In the simulations (SI Appendix, Fig. S5E), the position and extent of the myosin domain was initialized consistent with the experimental data. (D) Experimental spatially-averaged tangential velocity as a function of time after symmetry breaking for 5 wildtype, 4 fat2, and 6 toll vl embryos. (E) Pole cell position (pospc) as a function of time for 6 wildtype, 5 fat 2, and 7 toll vl embryos. (F) View of the posterior of a wildtype (Left) and toll vl (Right) embryo imaged for sqh::GFP. (Scale bar, 10 μm.) (G) Quantification of the offset between the position of maximum curvature and the center of the patch of posterior myosin (Myo-Curv Offset) for 4 wildtype and 4 toll vl embryos. Comparisons in B, D, E, and G performed using two-tailed unpaired t tests. ns, not significant; *P < 0.05; **P < 0.01; ***P < 0.001.

