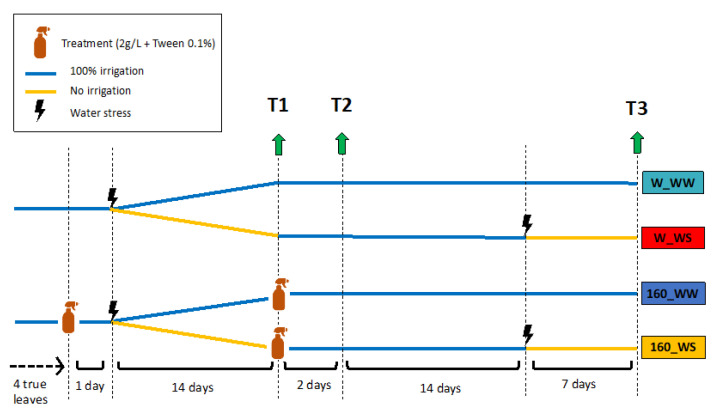
Figure 6.
Schematic representation of the experimental design with the sampling time points for molecular and physiological analysis. Tomato plants were grown in the absence (W_WW, 160_WW) and presence of drought stress (W_WS, 160_WS) and sampled after first water stress period (T1), two day after recovery (T2) and at the end of the second water stress (T3).

